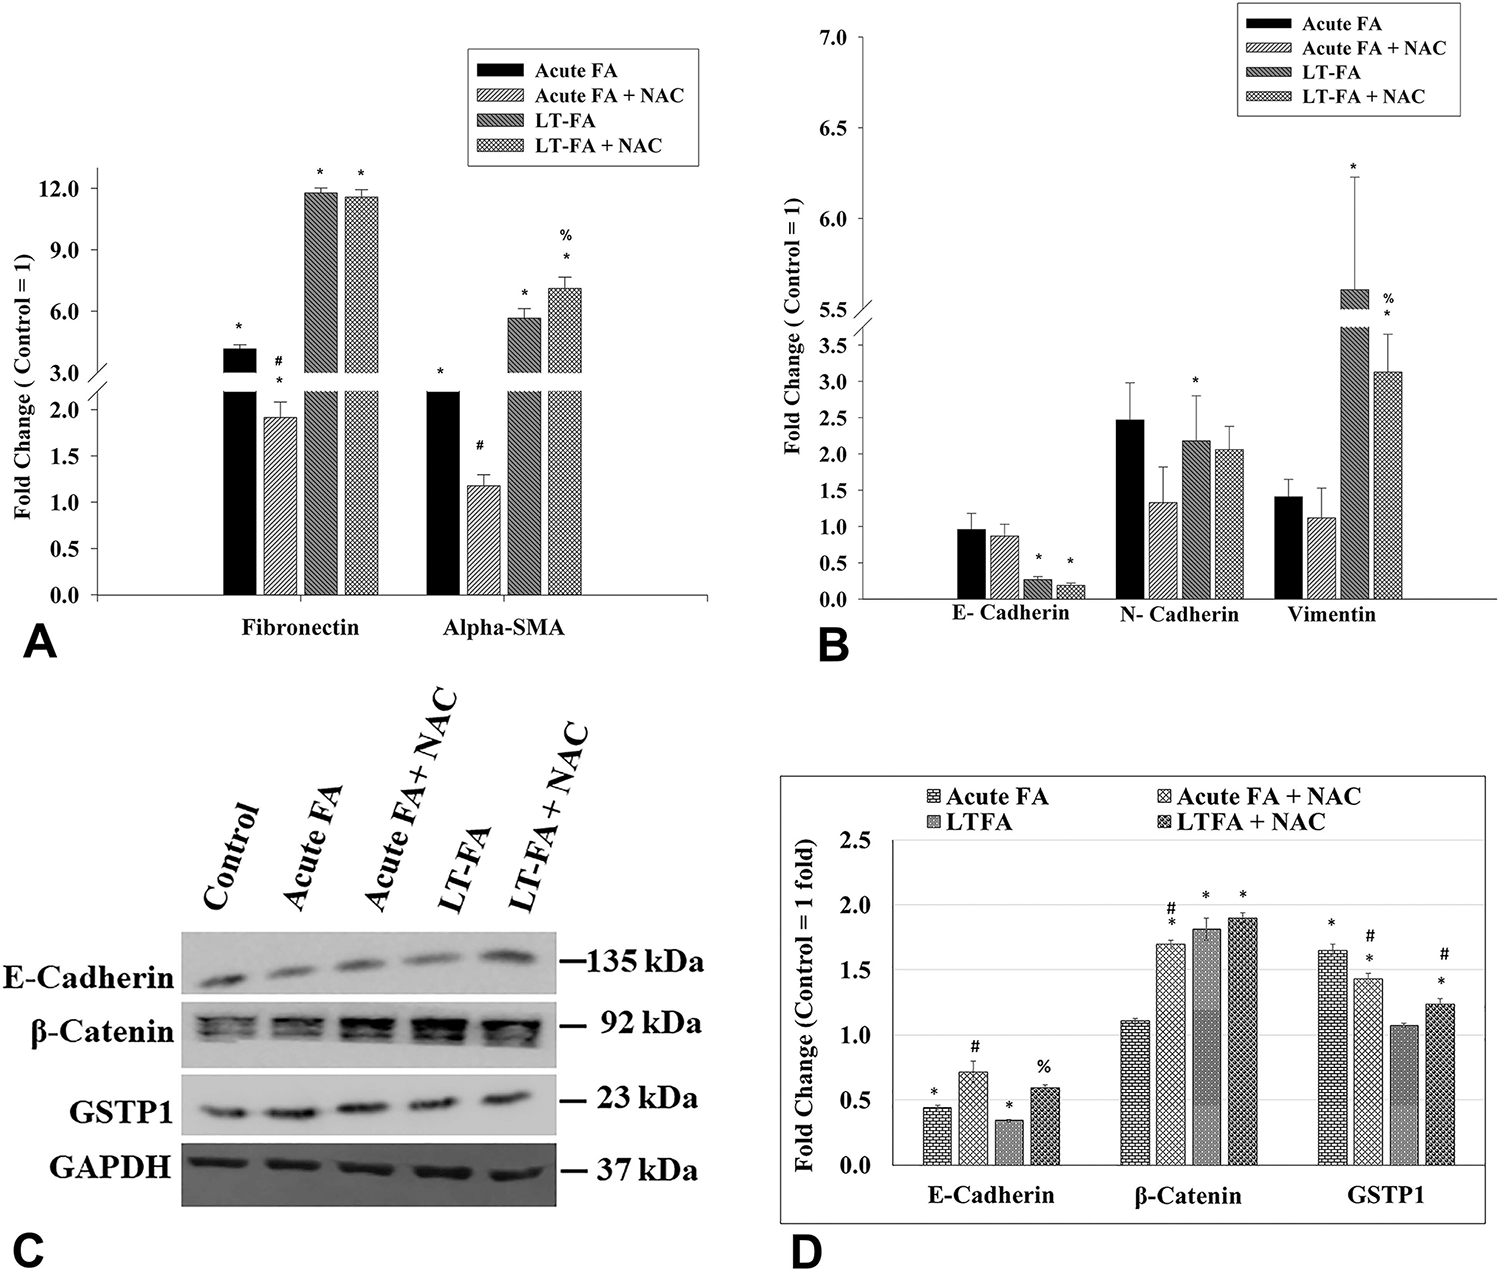
Figure 5.

Effect of acute and long-term exposure to folic acid (FA) on the expression of marker genes transcripts for fibrosis and EMT (in Caki-1 cells as measured by quantitative real-time PCR (qRT-PCR)) (A,B) and on the expression of E-cadherin, β-catenin, and GSTP1 proteins as measured by Western blot analysis (C,D). Bar graphs represent the fold changes in the expression of gene transcripts of fibronectin and alpha-SMA (A), and E-cadherin, N-cadherin, and vimentin (B), in both acute (acute FA) and long-term (LT-FA) FA-treated Caki-1 cells as compared to untreated control cells (control = 1-fold). Images of Western blots of E-cadherin, β-catenin, GSTP1, and GAPDH (internal control) proteins in Caki-1 cells (C), and their band intensities (in arbitrary units) as measured by ImageJ software (D). The band intensity of each protein was normalized by the band intensity of the internal control GAPDH from each sample, and the bar graph was plotted using values in arbitrary units. Error bar showing the standard deviation (±SD) of the mean of triplicate values. Statistically significant (P < 0.05) changes in treated groups as compared to the control are shown by the symbol “*”. A statistical significance of the cotreatment of NAC as compared to folic acid alone acute treatment is shown by the symbol “#”, whereas statistically significant changes in the cotreatment of NAC and FA as compared to FA alone in long-term treated cells are shown by the symbol “%”.
