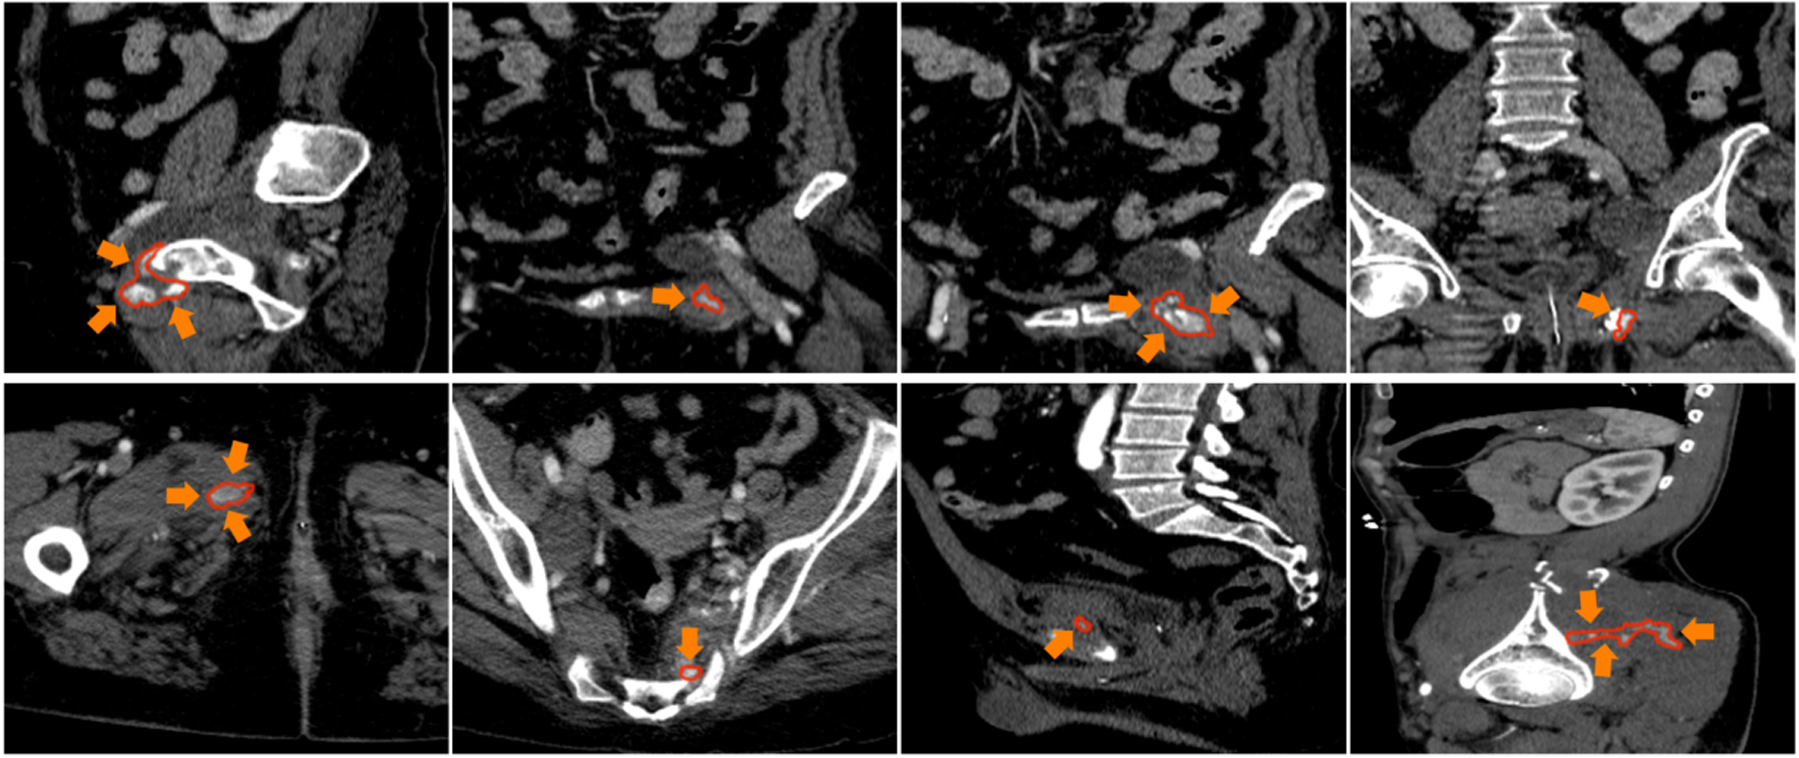
Fig. 1. Visual examples of pelvic CT scans from axial/coronal/saggital views.

Red contour denotes the boundaries of the active hemorrhage, where we can observe large variations of shape and textures.

Red contour denotes the boundaries of the active hemorrhage, where we can observe large variations of shape and textures.