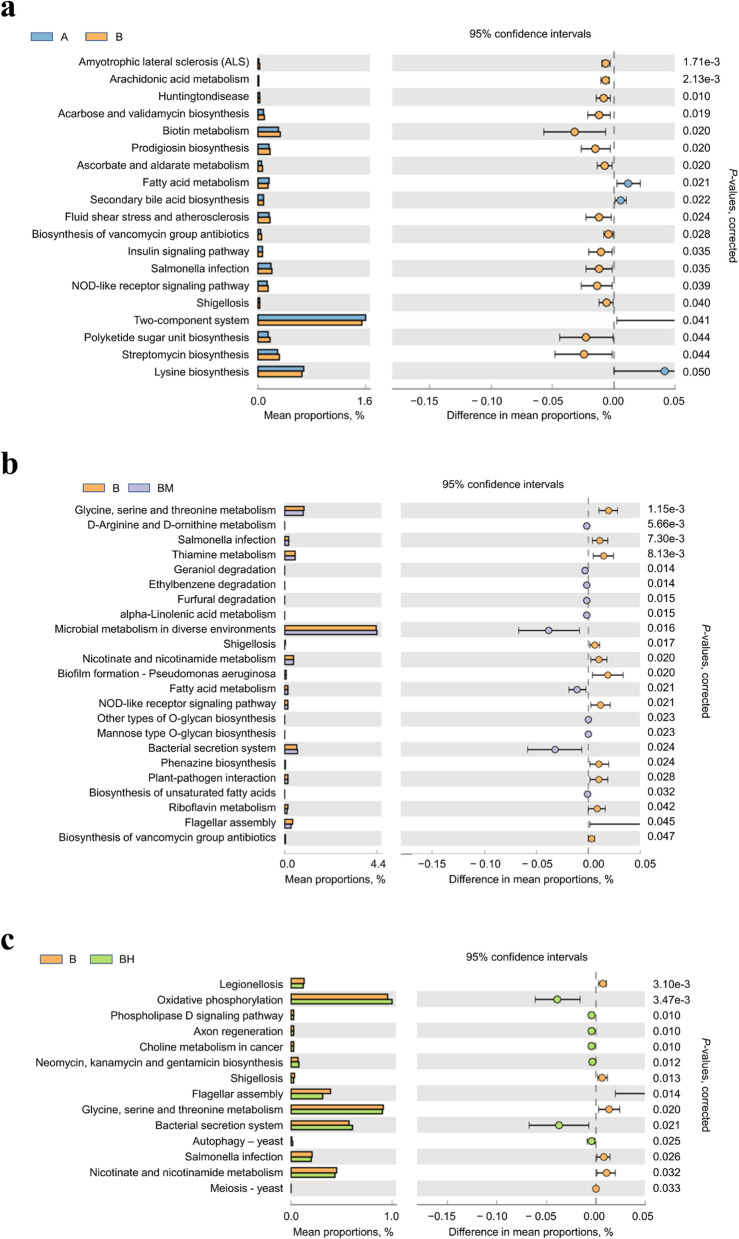
Fig. 6.
PICRUSt metagenome inference analysis based on 16S rRNA dataset: (a) A vs. B, (b) B vs. BM, and (c) B vs. BH. (a–c) Prediction of significant KEGG pathways (level 3) that were differentially regulated in SE-infected group compared to non-infected group (P < 0.05). Mean proportion of functional pathways is illustrated with bar plots and dot plots indicate the differences in mean proportions between two groups based on P-values obtained from two-sided Welch’s t-test. A: broiler chickens with basal diet and no infection, B: broiler chickens with basal diet and SE infection, BM: broiler chickens with basal diet supplemented with 500 mg/kg EOA and SE infection, BH: broiler chickens with basal diet supplemented with 800 mg/kg EOA and SE infection. EOA: coated essential oils and organic acids mixture, KEGG: Kyoto encyclopedia of genes and genomes, SE: Salmonella Enteritidis

