
Figure 4.
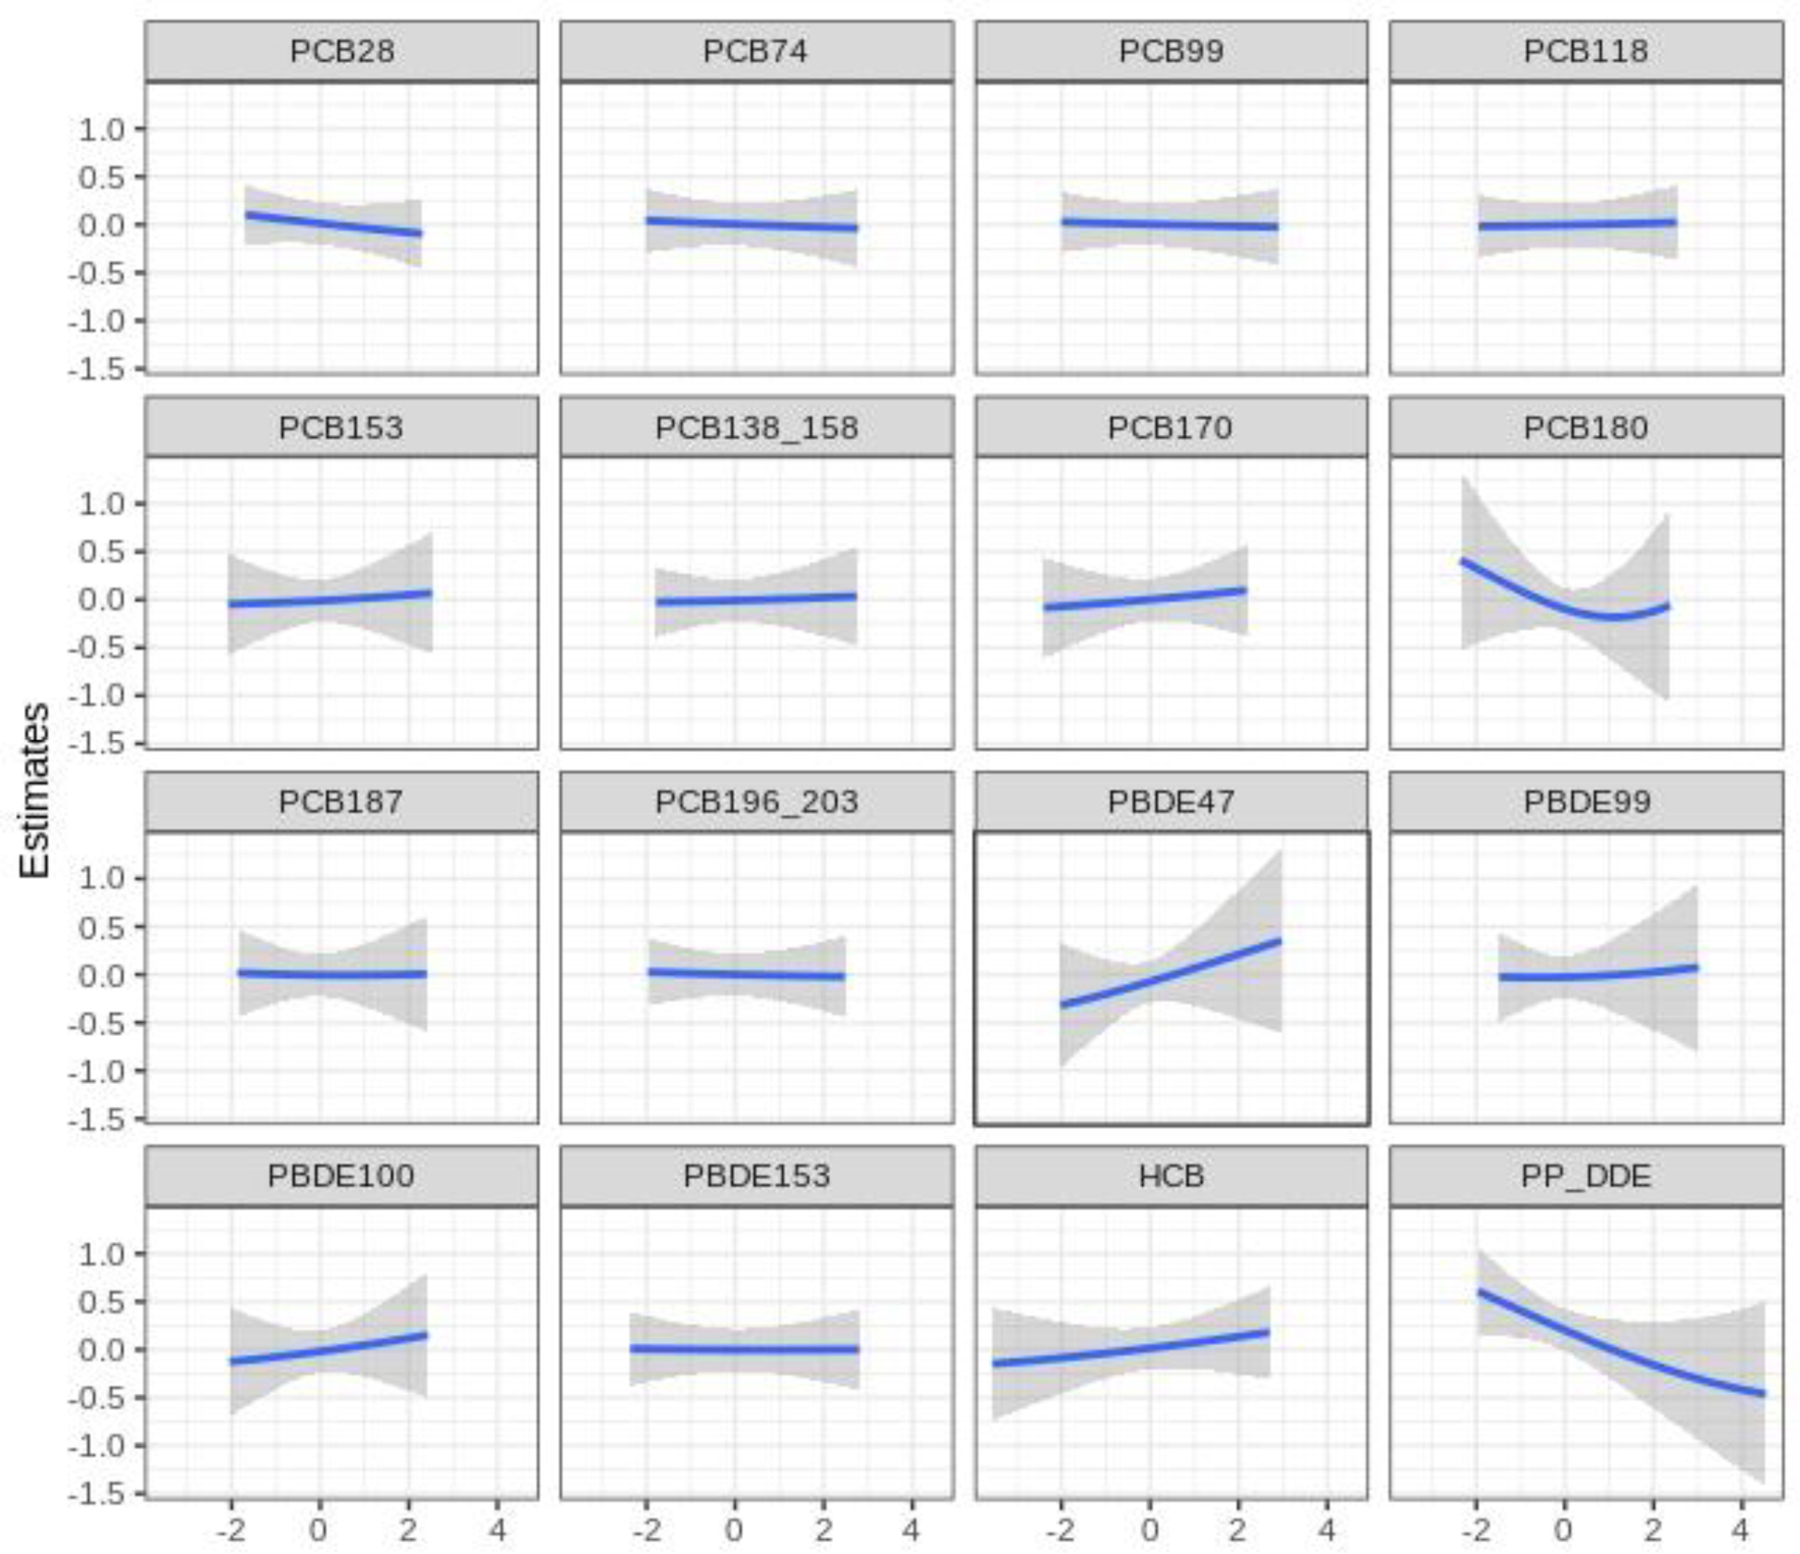
Univariate exposure-response functions for SRS score from the BKMR model. Associations between each POP and SRS score (with corresponding 95% confidence intervals) are shown when setting all other POPs at their median. Models adjusted for study site, child’s sex, maternal education, maternal race, and maternal pre-pregnancy BMI.