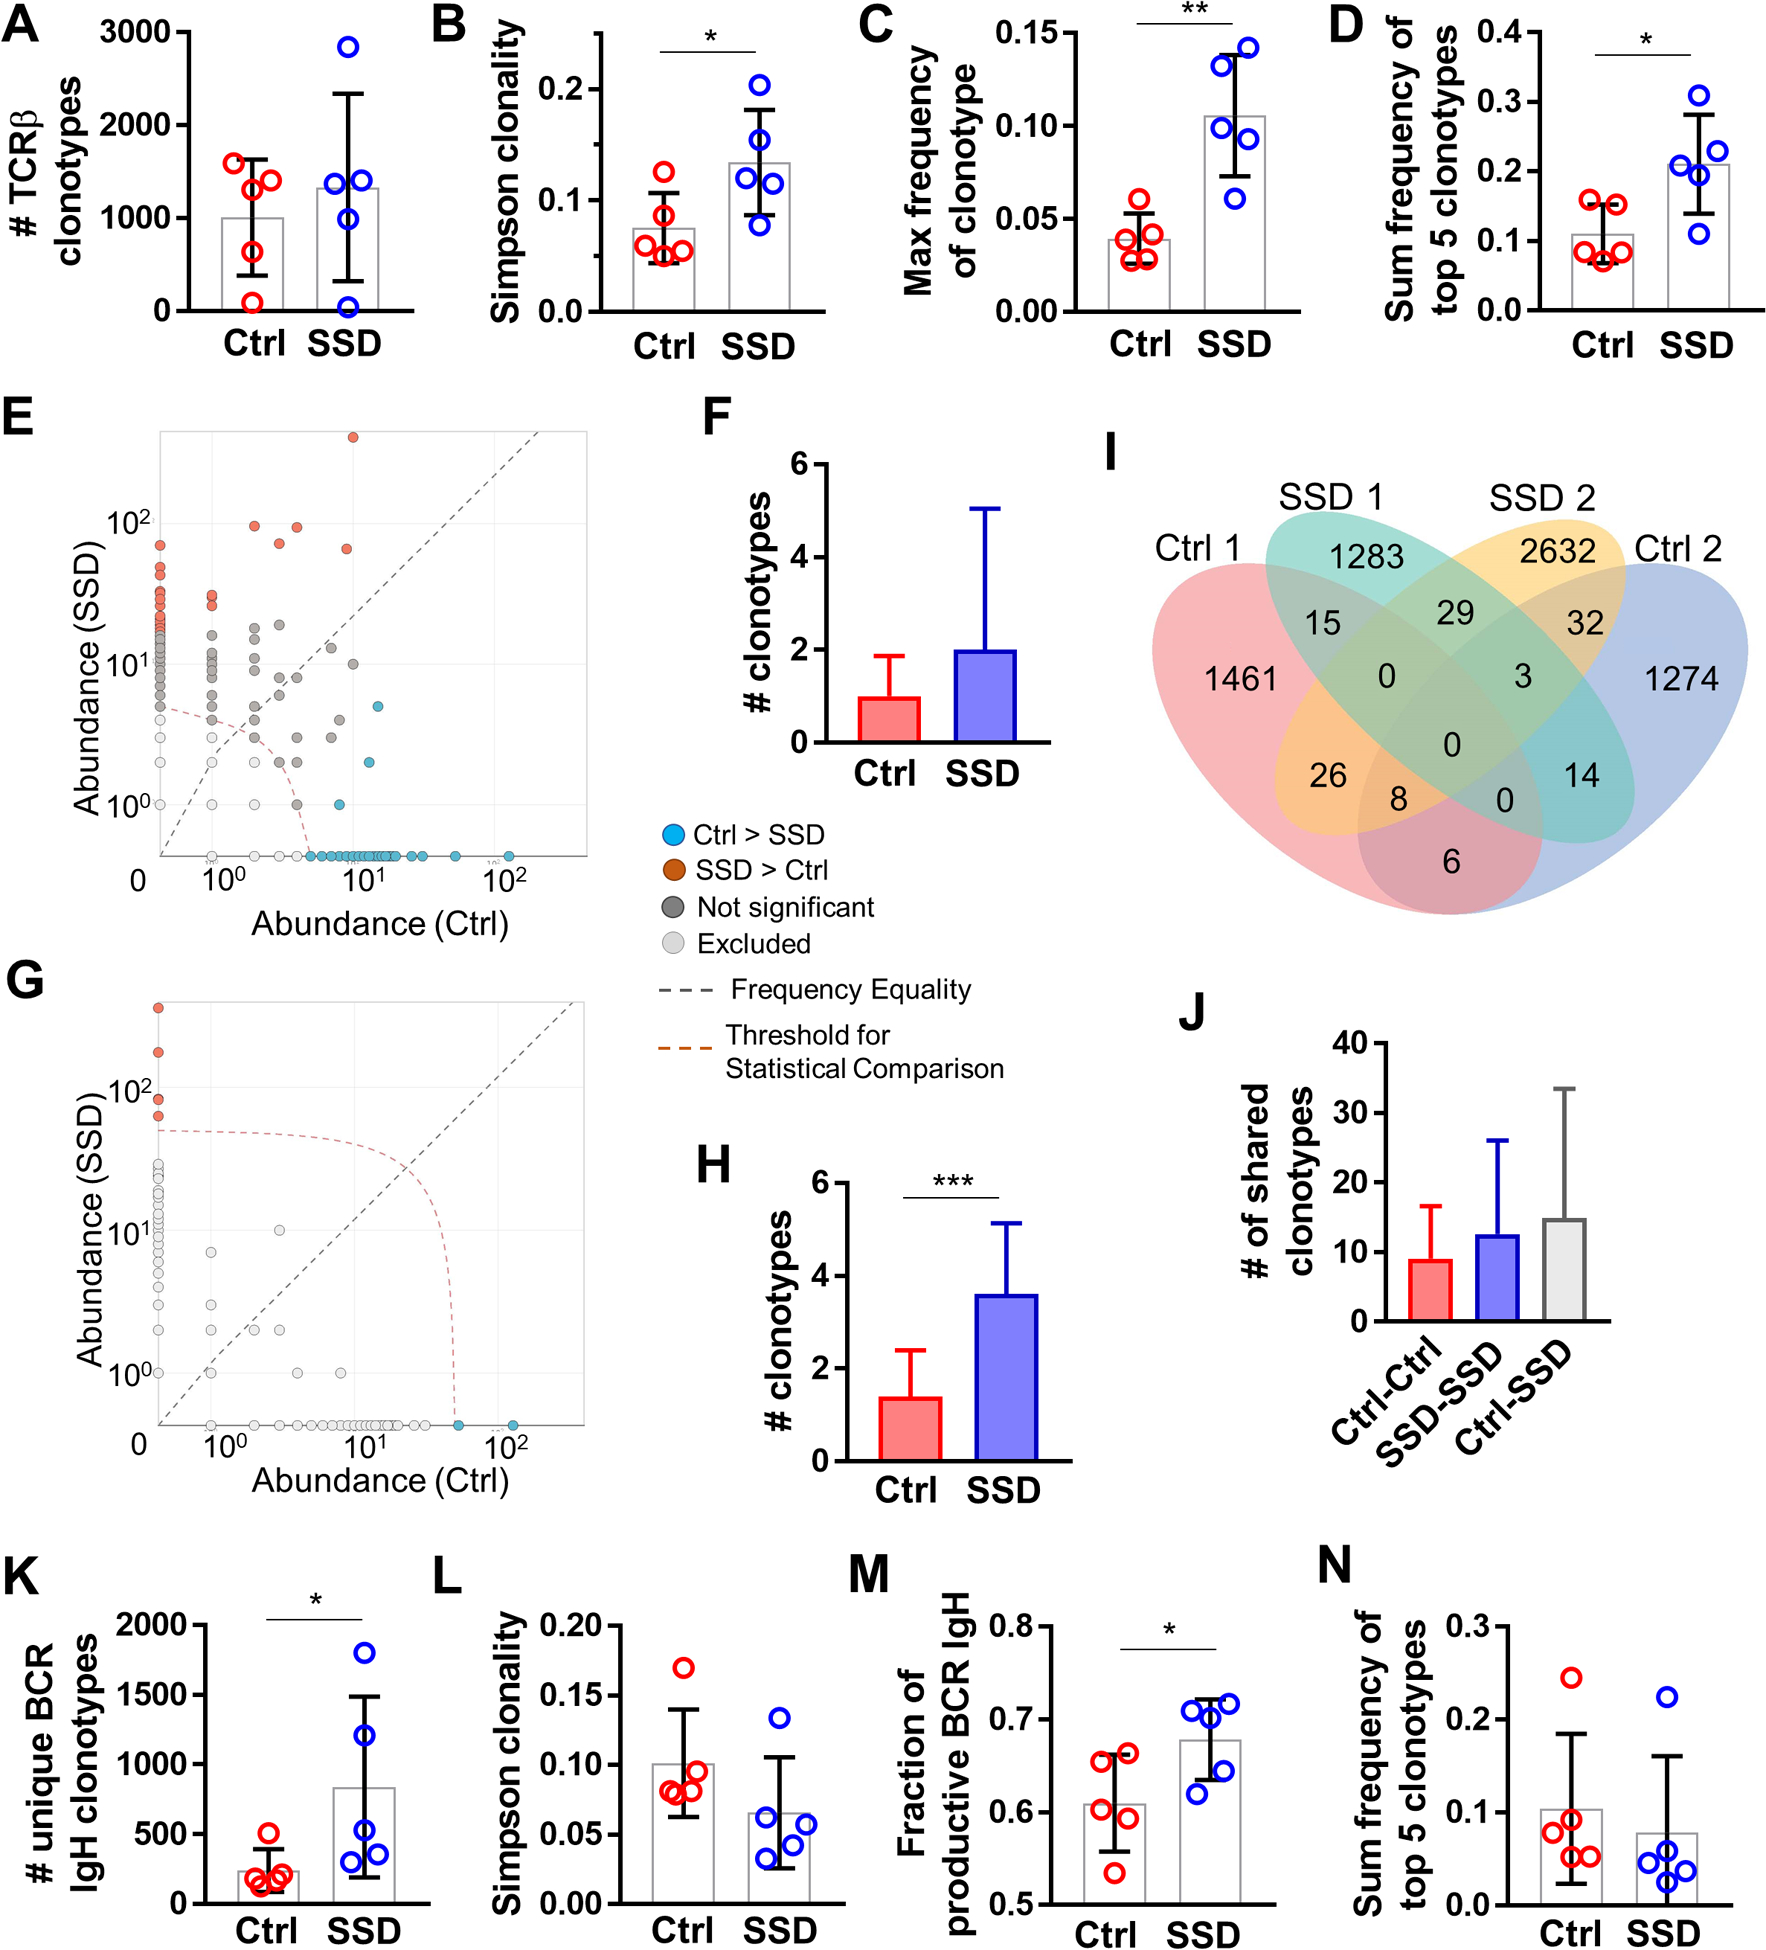
Figure 6. Sensory neurons modulate T-cell and B-cell repertoires in the TME.

TCRβ CDR3 immuno-sequencing of B16F10 tumors from control vs. SSD-treated C57BL/6 mice; n=5 tumors per group. (A) Total number of productive unique TCRβ clonotypes per tumor. (B) Simpson clonality of TCRβ clonotypes per tumor. (C) Frequency of the most abundant TCRβ clonotype per tumor. (D) Sum of frequencies of top 5 most abundant TCRβ clonotypes per tumor. (E) Representative pairwise differential abundance plot demonstrating shared TCRβ clonotypes with > 5 abundance (above the indicated threshold) and significantly higher frequency in either control (blue) or SSD (brown) group. (F) Pairwise analysis of control vs SSD groups as in E, demonstrating shared TCRβ clonotypes between control and SSD groups with > 5 abundance, and significantly overrepresented in either group. (G) Representative pairwise differential abundance plot demonstrating unique clonotypes with > 50 abundance (above the indicated threshold) in either control (blue) or SSD (brown) group. (H) Pairwise analysis of control vs SSD groups as in G, demonstrating unique TCRβ clonotypes in control or SSD group with > 50 abundance. (I) Representative Venn diagram of unique and shared TCRβ clonotypes in two of five tumors from control and SSD groups. (J) Number of shared TCRβ clonotypes from inter- and intra-group pairwise analyses. (K-N) BCR IgH CDR3 immuno-sequencing of B16F10 tumors from control vs. SSD-treated C57Bl/6 mice; n=5 tumors per group. (K) Total number of productive unique BCR IgH clonotypes per tumor. (L) Simpson clonality of BCR IgH clonotypes per tumor. (M) Fraction of productive BCR IgH clonotypes of total clonotypes per tumors. (N) Sum of frequencies of top 5 most abundant BCR IgH clonotypes per tumor. Data are means±SD, two-sided student’s t-test. *P<0.05, **P<0.01, ***P<0.001.
