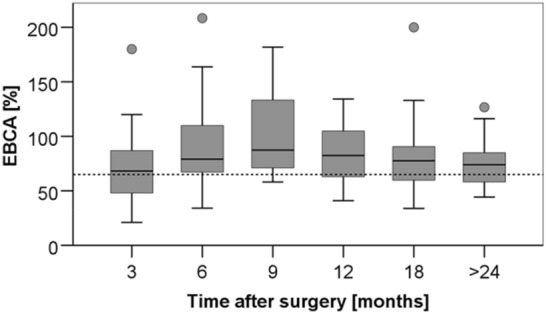
Fig. 2.

Median rate of BC related to EBCA. The dotted line is the limit below which children are considered to have decreased bladder capacity compared to estimated bladder capacity for their age (65% EBCA). There was an initial increase from median 66.7% (21.05–180) after 3 months to 79.1% (34.1–254.1) after 6 months, and to 87.4% (58.1–181.8) 9 months after surgery. Then it decreased again to 82.4% (41.0–134.2) 12 months after surgery and to 79.6% (36.8–200.0) 18 months and to 74.0% (44.2–126.7) > 24 months after surgery. The variation of the median values was not significant (p = 0.41, Kruskal–Wallis test). There was no significant difference between the two groups (graphs not shown)
