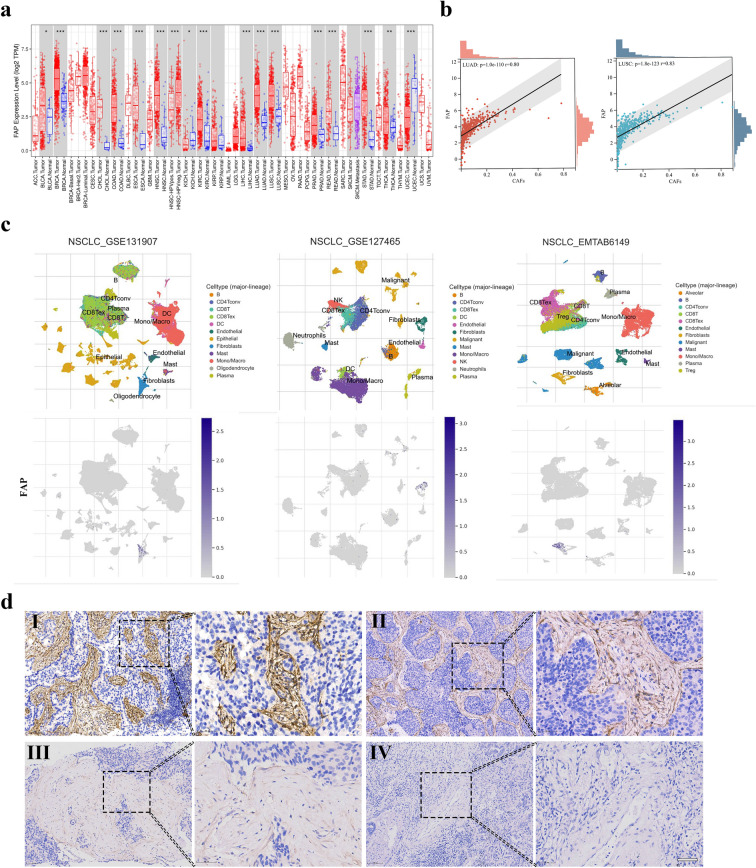
Fig. 1.
FAP expression in the stroma of advanced NSCLC tissues. a Expression of FAP in tumor tissues and normal tissues of the NSCLC cohort in the TCGA database. b Correlations of FAP with the cluster of CAFs in the TME of NSCLC. c FAP expression in NSCLC as visualized by single-cell analysis from the TISCH database. d Representative IHC images of tumors showing FAP staining: (I) high intensity, (II) medium intensity, (III) low intensity and (IV) negative staining. (brown = FAP; blue = hematoxylin nuclear staining). Scale bar = 50 µm. * P < 0.05; ** P < 0.01 and *** P < 0.001

