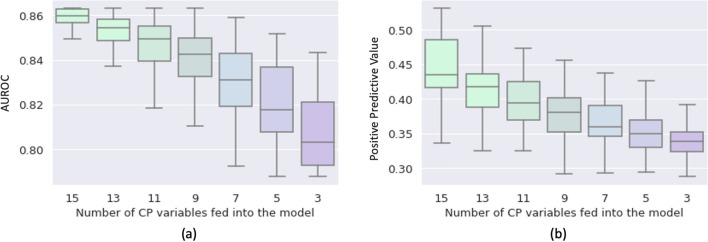
Figure 4.
Performance of MeTra in terms of the AUROC values (a) and the positive predictive values (b) as a function of the number of clinical parameters available to the model. The x-axis denotes the number of clinical parameters fed into the model alongside the chest radiograph. For each number of clinical parameters, the experiment was repeated 100 times with randomly chosen subsets of variables to prevent bias due to the choice of variables.

