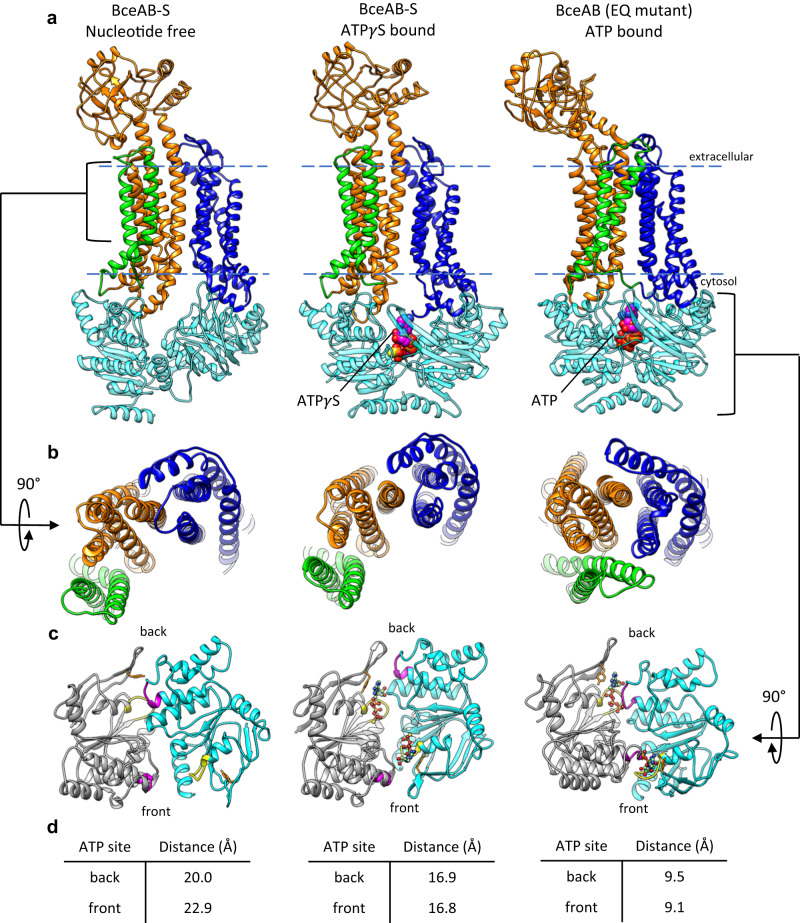
Fig. 6. Comparison of BceAB-S and BceAB Structures.
a Comparison of the conformations adopted by BceAB either in isolation or in complex with the BceS kinase, and in different nucleotide states. BceS is omitted for clarity. Whereas binding of ATP (magenta spheres) to isolated BceAB induces closure of the TM helices, binding of ATPγS (magenta spheres) to the whole BceAB-S complex does not induce a collapse of the BceB TM helices. Blue dashed lines indicate the approximate boundary of the lipid bilayer. b 90° rotated view relative to a showing the TM helix arrangement of BceB in each structure. c View of the BceA NBDs in the three structures. For clarity, one BceA monomer is colored grey and the other monomer is colored cyan. The Walker A motif is colored yellow, and the ABC signature motif is colored magenta. ATPγS and ATP are shown as ball-and-sticks. d Distance measured between residue 47 in the Walker A motif and 146 in the ABC signature motif for the two ATP binding sites in a dimer of BceA. The front and back sites are indicated in c.

