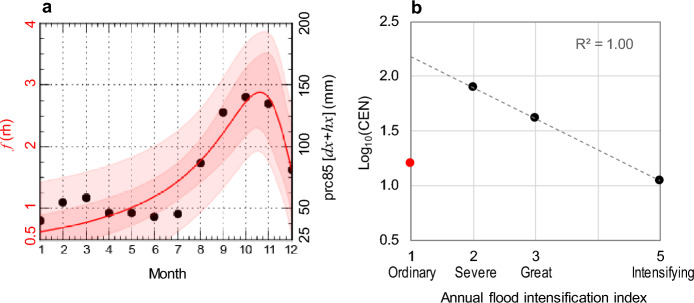
Figure 3.
Precipitation and flood regimes. (a) Monthly regime of the 85th percentile (prc85) of the sum of daily (dx) and hourly (hx) maximum monthly rainfall (black dots), and Rationale Model function, f(rh), for flood intensification recognition (red line) during the period 2005–2021 (Supplementary Table S1); (b) Cumulative distribution of the logarithm of the number of flood events versus their Annual Flood Damage Index (AFDI) in the ELA during the period 1582–2022 CE. The magnitude 1 of AFInIx (red dot) is not aligned around the dashed line, so this type of event is considered incomplete in the catalogue and is deleted from the time-series to homogenise the catalogue.

