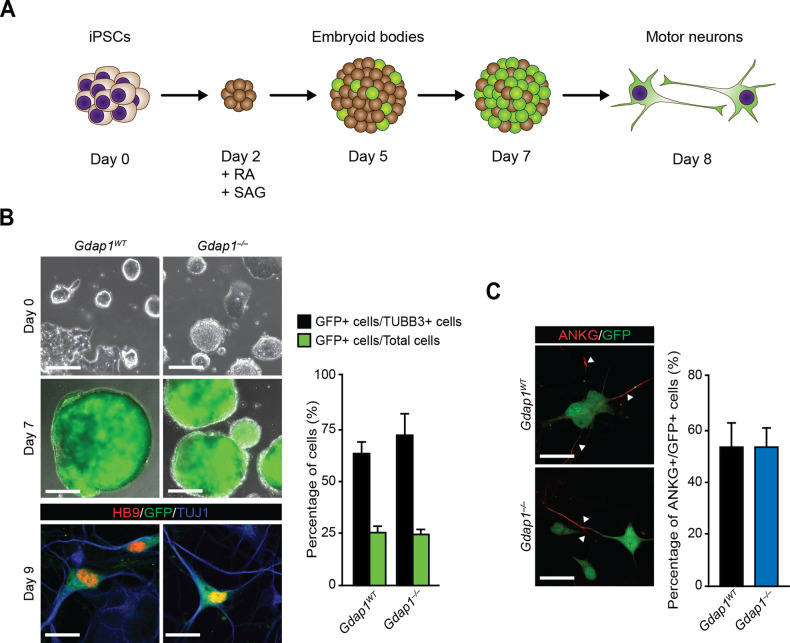
Fig. 1. MN differentiation efficiency of Gdap1WT and Gdap1–/– iPSCs was similar.
A Schematics of iPSCs MN differentiation. Retinoic acid (RA) and smoothened agonist (SAG) are indicated. B Upper panels, phase contrast images of undifferentiated iPSC. Middle panels, fluorescence (EGFP, green) and phase contrast merged images of EBs at d7 of differentiation. Lower panels, confocal images of MNs 2 days after plating (d9) stained with indicated antibodies. Bars, 130 μm, 500 μm, and 20 μm, respectively. Right graph, percentage of EGFP-positive cells relative to either Tbb3-positive cells (black bars) or total cells (green bars) (n = 3). C Left: confocal images of d9 MNs stained with indicated antibodies. Bars, 20 μm. Right graph, percentage of ANKG-EGFP double positive cells relative to total EGFP-positive cells. Data are represented as mean ± SEM from at least three experiments. No statistical significance between genotypes was observed (one-tailed Student’s t-test).

