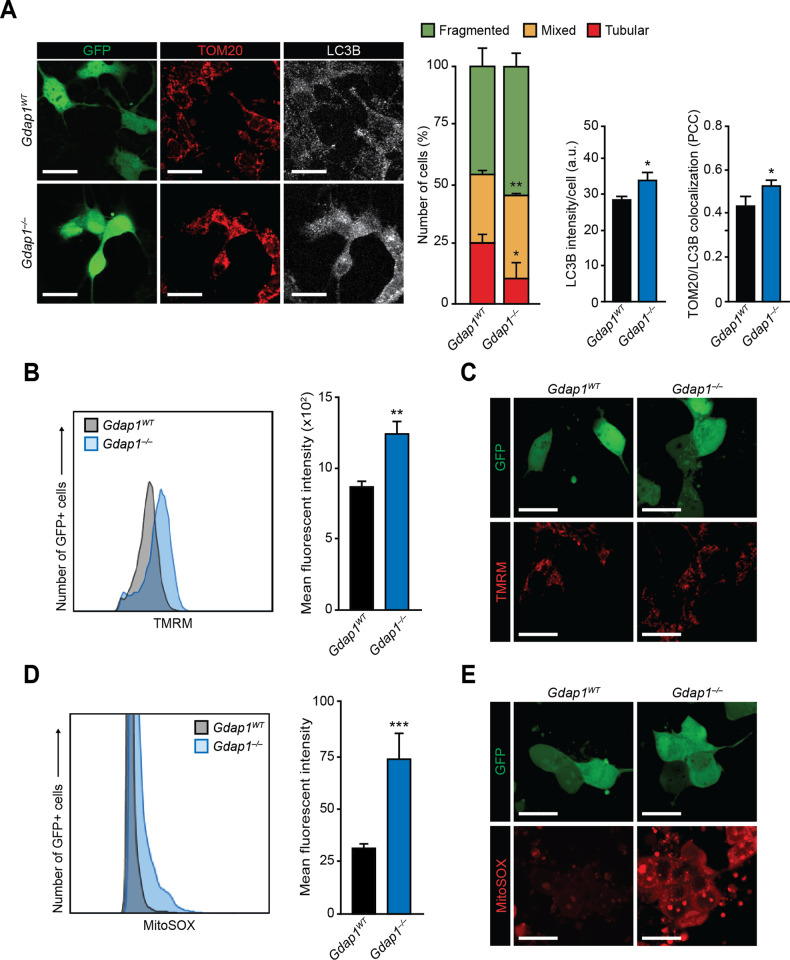
Fig. 3. Altered mitochondrial functionality in Gdap1–/– MNs.
A Left: confocal images of MNs 2 days after plating (d9) that were fixed and stained with the indicated antibodies. Bars, 20 μm. Right: quantification of the observed mitochondrial morphologies (left graph), LC3B mean signal intensity per cell (middle graph) and colocalization of LC3B and TOM20 assessed by Pearson’s correlation coefficient (PCC) of both signals in MNs (right graph). B Histogram: TMRM-uptake assessed by flow cytometry of MNs at d7 of differentiation. Graph: quantification of the mean fluorescent intensities of the histograms. C Confocal images of MNs 2 days after seeding (d9) that were stained with TMRM. Bars, 15 μm. D Histogram: mitochondrial superoxide assessment by flow cytometry analysis in MNs at d7. Graph: quantification of the mean fluorescent intensities in histograms. E Confocal images of cultured MNs 2 days after seeding (d9) stained with MitoSOX to detect mitochondrial superoxide. Bars, 15 μm. Data are represented as mean ± SEM from at least three independent experiments. The one-tailed Student’s t-test was used to assess statistical significance between genotypes (*P < 0.05; **P < 0.01; ***P < 0.001).

