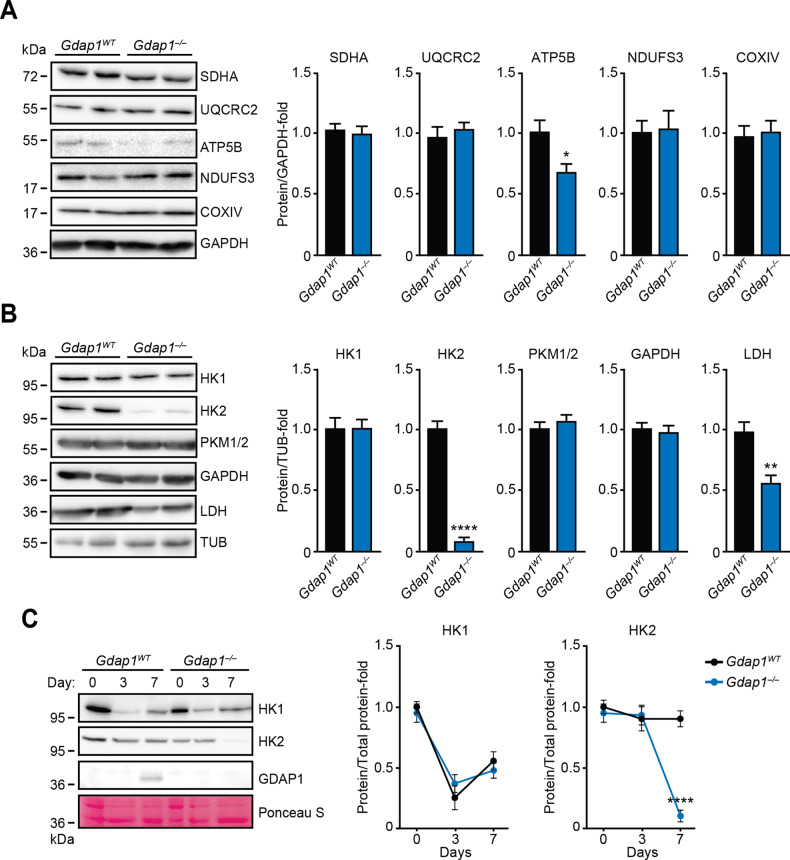
Fig. 5. Gdap1–/– cells differentiated into MNs showed altered metabolic enzyme expression.
A, B Left: cell lysates of EBs at d7 of differentiation were analyzed by immunoblotting using indicated antibodies. Right: graphs showing quantification of immunoblots. C Left: cell lysates from undifferentiated iPSCs (day 0), or EBs at the indicated days of differentiation were analyzed by immunoblotting using the antibodies shown. Loading control: Ponceau-S staining. Right: quantification of immunoblots (n = 3). Data are represented as mean ± SEM from at least three independent experiments. The one-tailed Student’s t-test was used to assess statistical significance between genotypes (*P < 0.05; **P < 0.01; ****P < 0.0001).

