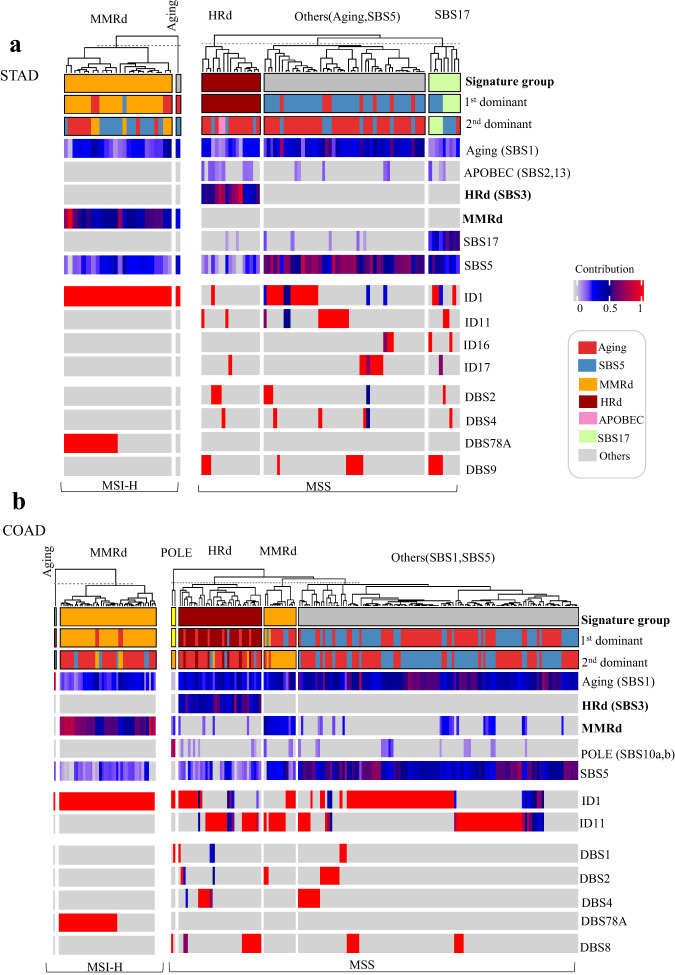
Fig. 1.
Mutational signature analysis of WES data from MSI-H and MSS STAD and COAD tumors. (a,b) NMF-based de novo mutational signatures of STAD (a) and COAD (b) tumors visualized by a heatmap divided based on distinct signature status. The first and second dominant signatures are annotated at the top. STAD and COAD tumors’ MSI-H and MSS status are annotated at the bottom. Hierarchical clustering was performed based on the relative contribution of signatures in each tumor. Color codes represent each mutational signature shown. The color scale shows the contribution values of each mutational signature. For mutational signatures with known etiology, both signature and etiology are indicated.

