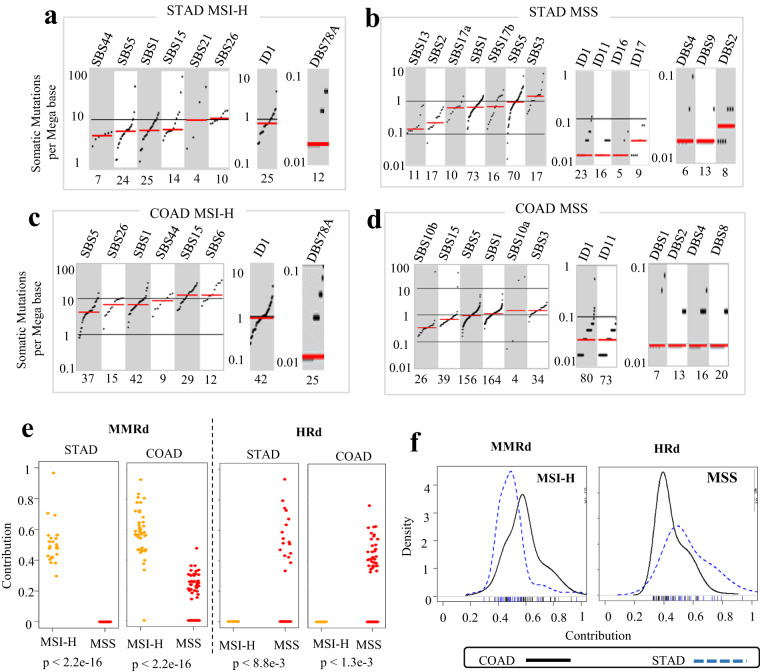
Fig. 2.
TMB and contribution of mutational signatures in WES data from MSI-H and MSS STAD and COAD tumors. (a–d) TMB of SBS and ID and DBS signatures for MSI-H and MSS STAD and COAD tumors, respectively. TMB is measured in somatic mutations per Megabase (Mb). In the TMB plots, columns represent the detected mutational signatures and are ordered by mean somatic mutations per Mb from the lowest frequency, left, to the highest frequency, right. Numbers at the bottom of the TMB plots represent the numbers of tumors harboring each mutational signature. Only samples with counts more than zero are shown. (e) Relative contribution of the MMRd and HRd signatures identified among MSI-H and MSS tumors in STAD and COAD. Each point represents the value of contribution detected in individual tumor specimens. P values were calculated by two-tailed Mann Whitney U test. (f) Distribution of relative contribution for MMRd signature in MSI-H tumors (left side) and HRd signature in MSS tumors (right side) shown in density plots. The X axis represents contribution. Ticks for each contribution value are presented under the distribution curves. The Y axis is a kernel density estimate to show the probability density.

