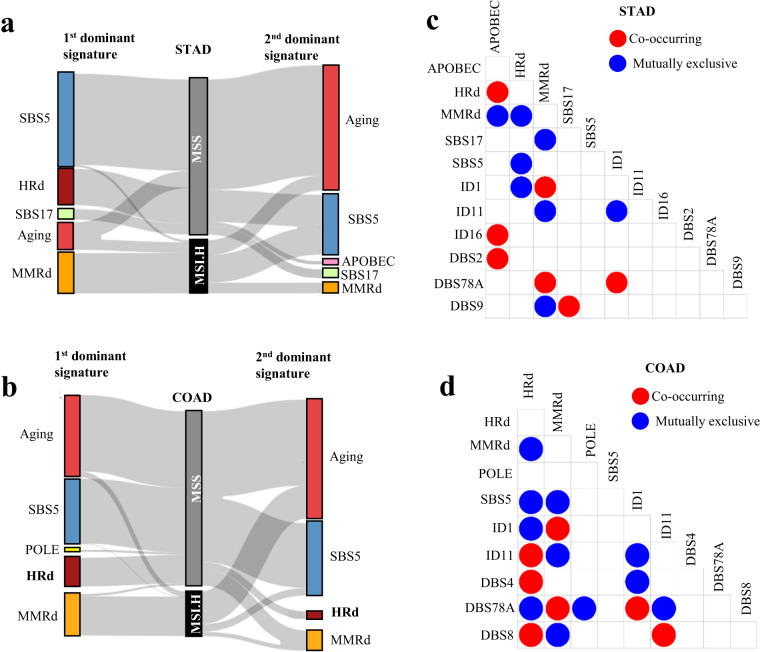
Fig. 3.
Dominant signatures and interaction analysis of WES data from MSI-H and MSS STAD and COAD tumors (a,b) The first and second dominant SBS mutational signatures in MSI-H and MSS STAD and COAD tumors. Dominant signatures were based on the contribution value of detected mutational signatures. (c,d) Pair-wise statistical interaction of signatures measured by hypergeometric test: red represents co-occurrence and blue represents mutual exclusivity.

