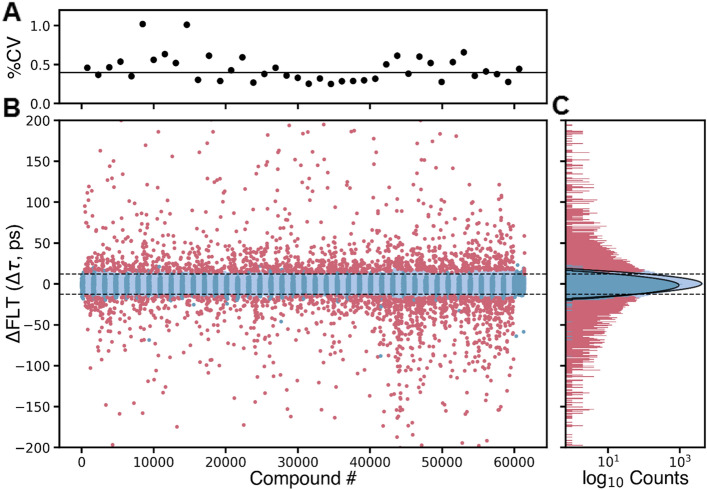
Figure 2.
FLT HTS of the DIVERSet library of 50,000-compounds, using the approach described in Fig. 1A to identify initial hit compounds. (A) Screening precision was determined by computing %CV for each plate using DMSO control wells, with a median value of 0.4% across 40 plates. (B) The change in lifetime (Δτ) was computed to find potential hits (red) with hit threshold set at rZ-score = ± 3, resulting in 2960 initial hits for triage with the SUPR instrument. DMSO controls (dark blue) and compounds not affecting 2CS (light blue) are grouped in the plot to illustrate plate boundaries. (C) The histogram of compounds not affecting 2CS (light blue, 1 ps bin width) shows normal distribution, similar to that of DMSO controls (no compound), as shown by a fit of the populations to Gaussian distributions. The horizontal lines in (B,C) illustrate the approximate cutoffs used, though actual cutoffs were determined on a plate-by-plate basis.

