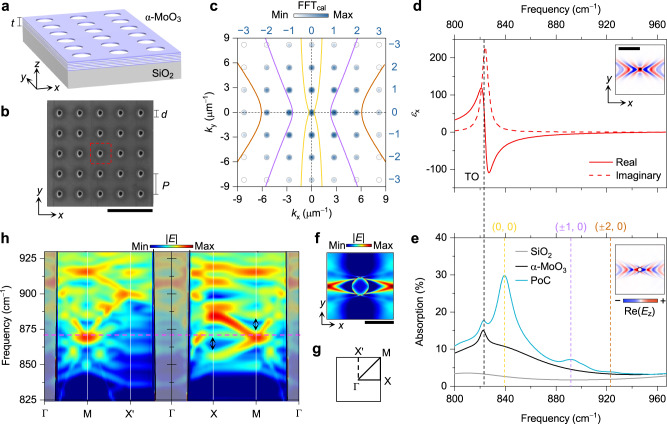
Fig. 2. Hyperbolic polaritonic crystals (PoCs) made of a periodically perforated α-MoO3 slab.
a Schematic of a square-lattice PoC with the thickness (t) of 235 nm. b Scanning electron microscope (SEM) image of a square-lattice PoC with the periodicity (P) of 2.3 μm and diameter (d) of 0.6 μm. Red dashed square indicates the unit cell. Scale bar, 5 μm. c Calculated isofrequency contours (IFCs) of phonon polaritons (PhPs) and Fast Fourier Transform (FFTcal) amplitude maps of the PoC. Grey circles represent reciprocal space points. The yellow, purple, and brown curves were calculated at 840, 892, and 925 cm–1, respectively. d Optical permittivity (εx) of α-MoO3 along the x direction. Inset, simulated hyperbolic wavefronts of PhPs in the α-MoO3 slab excited by a point dipole (black dot). Scale bar, 3 μm. e Calculated absorption coefficients of the SiO2 substrate, the plain α-MoO3 slab supported by SiO2, and the PoC. Black, yellow, purple, and brown dashed lines indicate the transverse optical (TO) phonon frequency and Bragg resonance frequencies. Inset, simulated electric field distribution around a single hole (white dot) in the α-MoO3 slab excited by a plane wave. f Simulated electric field distribution (|E|) of the Bloch mode in a unit cell at the frequency of 872 cm–1 (marked by the magenta dashed line in (h)). Scale bar, 1 μm. g The first Brillouin zone of the square-type PoC. h Calculated band structure of the PoC. Black arrows indicate the partially opened band gaps. Grey shaded areas represent the light cones.

