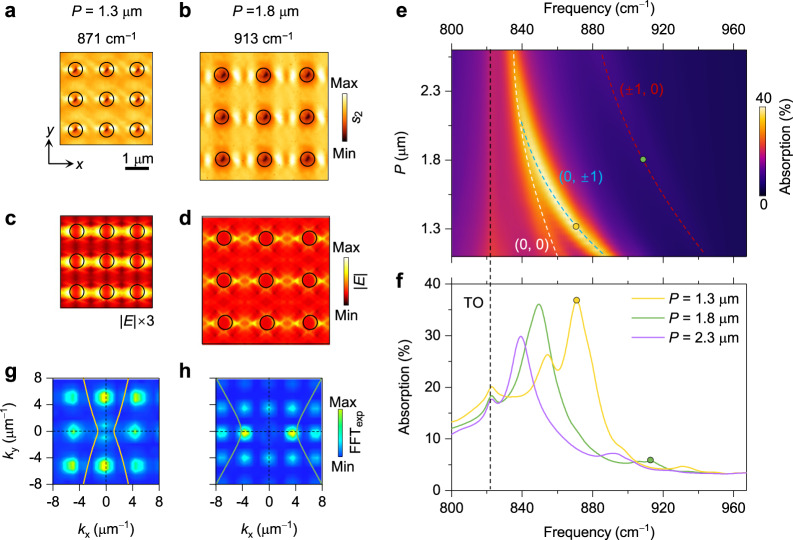
Fig. 4. Tuning PoC modes and resonances by varying lattice periodicity.
a, b Near-field amplitude images of PoCs with different periodicities. c, d Corresponding simulated electric field distributions (normalized to the one at 913 cm−1). Scale bar for (a–d), 1 μm. e Calculated absorption coefficients of PoCs as a function of frequency and periodicity. White, blue, and red dashed curves represent the (0, 0), (0, ±1), and (±1, 0) order branches. Black dashed curve indicates the pristine transverse optical (TO) phonon mode. f Absorption spectra of PoCs. The yellow and green dots indicate the frequencies in (a) and (b). g, h Corresponding FFT maps of the experimental near-field images in (a) and (b). The yellow and green curves represent the calculated IFCs of PhPs at 871 and 913 cm–1, respectively.

