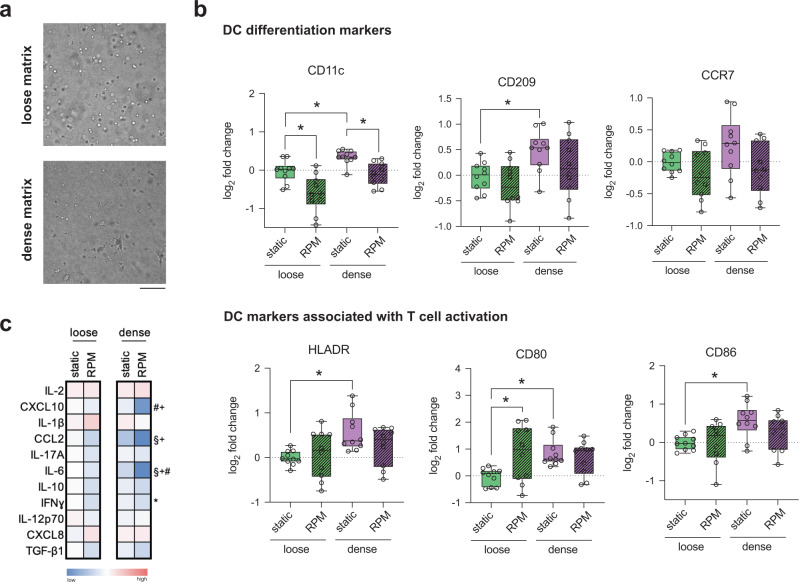
Fig. 5. Quantitative analysis of mDC surface markers and cytokines.
mDCs were cultured for 3 days under static or RPM conditions in loose and dense matrices. a Representative brightfield images of mDCs cultured in loose and dense matrices under static conditions. The scale bar represents 100 µm. b Analysis of surface markers associated with differentiation, namely, CD11c, CD209, and CCR7, and markers associated with T-cell activation, namely, HLADR, CD80, and CD86, using flow cytometry. The log2-fold change in geometric mean fluorescence intensity (gMFI) was calculated relative to samples cultured in loose matrices under static conditions. c Heatmap of the log2-fold change in cytokine secretion by mDCs cultured in loose and dense matrices under static and RPM conditions. The log2-fold change in the median concentration of cytokines (pg/mL) was calculated relative to cytokine secretion by mDCs cultured in loose matrices under static conditions. Experiments were performed with at least four replicates. The box and whiskers graphs used have the center line at the median value. The upper and lower bounds of the box extend from the 25th to 75th percentiles, and the whiskers are plotted to the minimum and maximum values. * indicates significance at p ≤ 0.05. For the heatmap, *indicates significant p ≤ 0.05 of samples in loose matrices cultured on the RPM compared to loose matrices under static conditions. # indicates significant p ≤ 0.05 of samples in dense matrices cultured on the RPM compared to dense matrices under static conditions. § indicates significant p ≤ 0.05 of samples in dense matrices cultured under static conditions compared to loose matrices cultured under static conditions. + indicates significant p ≤ 0.05 of samples cultured in dense matrices on the RPM compared to loose matrices on the RPM.

