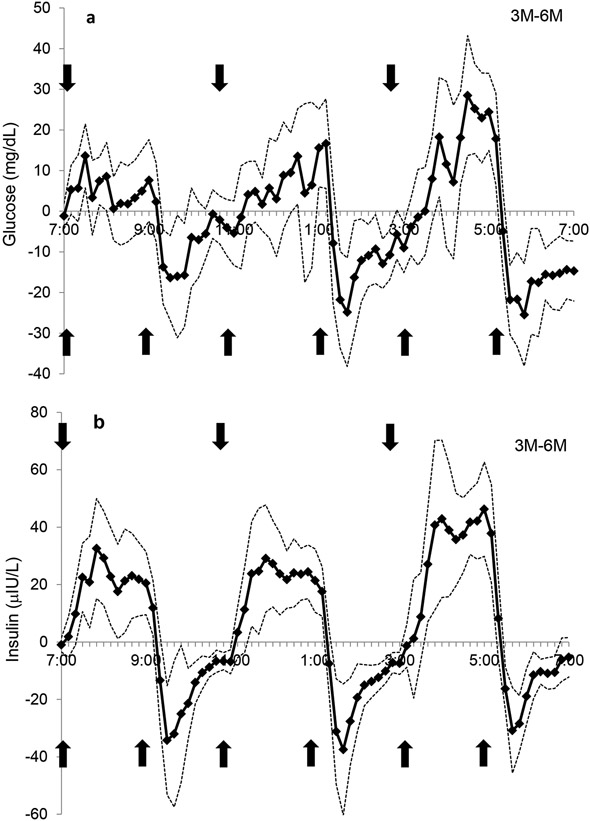
Figure 3.
The comparison of the 3M-6M day for A) glucose and B) insulin concentrations over 12-h. The solid line represents the difference between study days and simultaneous 95% confidence limits (dotted line) are shown. Significant stimulation of glucose or insulin release by the meal occurred when the lower 95% confidence limit was more than zero. Significant suppression of glucose or insulin release occurred when the upper 95% confidence limit was less than zero. Arrows indicate meals.  indicates a meal.

