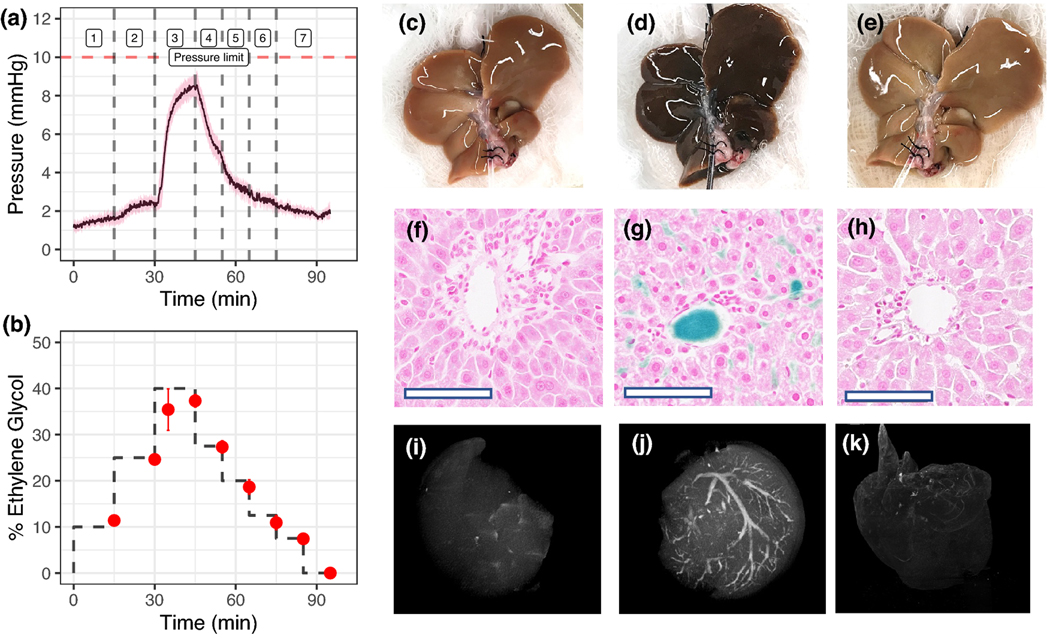
Figure 2. Hypothermic perfusion loading and unloading of cryoprotective agent (CPA) and silica coated iron oxide nanoparticles (sIONPs) in rat livers.
(A) Mean portal venous pressure over time during CPA (EG+Suc) loading and unloading in rat livers (steps in Table S3) (n = 6). (B) Percentage ethylene glycol in effluent samples collected from the IHVC during loading and unloading of CPA, determined by refractometry (n=4). (C-E) Gross images of control, CPA+sIONP loaded, and unloaded livers, respectively. (F-H) Prussian blue staining shows Fe deposition in control, CPA+sIONP loaded, and unloaded livers. Fe localization is seen in the liver sinusoids and the portal veins of a CPA+sIONP loaded liver. Bar = 100 μm. (I-K) X-ray μCT images of control, CPA+sIONP loaded, and unloaded livers, showing contrast from the iron oxide nanoparticles distributed throughout the liver vasculature (See Supplementary Materials files for 3D rotational images). Data are mean ± SEM.

