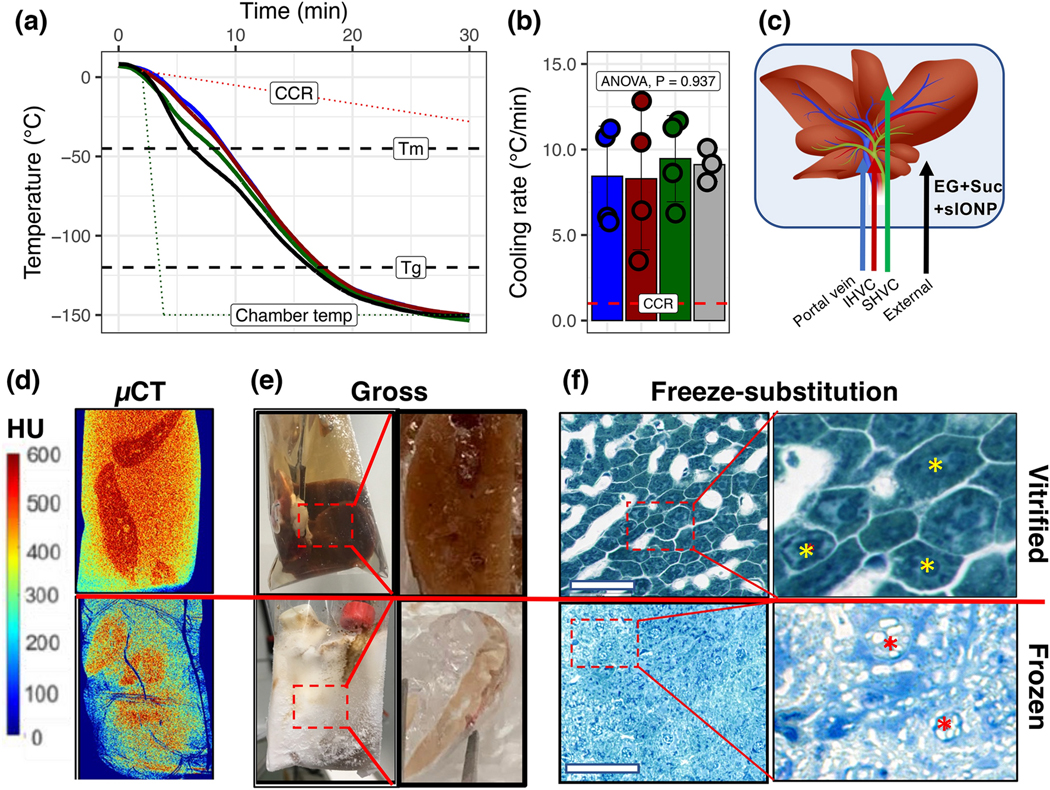
Figure 3. Vitrification of livers.
(A) Temperature vs. time plots during rapid cooling of a CPA-loaded liver for vitrification. Dashed lines indicate the critical cooling rate (CCR), melting temperature (Tm), glass transition temperature (Tg), and the temperature of the CRF (dotted line). (B) The average cooling rate for each probe location during cooling exceeds the CCR for CPA (EG+Suc) (dotted line). Data are mean ± SD (n = 4). (C) Position of the temperature probes for A and B within the liver. (D) X-ray μCT of a vitrified (top) vs. frozen (bottom) liver. X-ray attenuation, measured in Hounsfield Units (HU), was used to differentiate between amorphous (>400 HU) and crystalline regions (<400 HU) in the liver. For size reference, the cryobags are 3” x 5”. (E) Gross images of vitrified (top) and frozen (bottom) livers. Zoomed callout regions show gross tissue cross-sections of liver lobe pieces broken and exposed at cryogenic temperatures where a clear contrast was seen between vitrified vs. frozen. (F) Brightfield microscopy images of toluidine blue stained freeze-substituted liver sections following vitrification (top) and freezing (bottom) show intact cellular and sinusoidal architecture in vitrified samples and complete loss of architecture in both hepatocytes and sinusoidal endothelial cells in frozen livers. White space in the vitrified sample indicates the vasculature, whereas cells (yellow asterisks) show no ice. White space in the frozen samples between and within cells (red asterisks) indicates the presence of vascular and intracellular ice. Bar = 100 μm.

