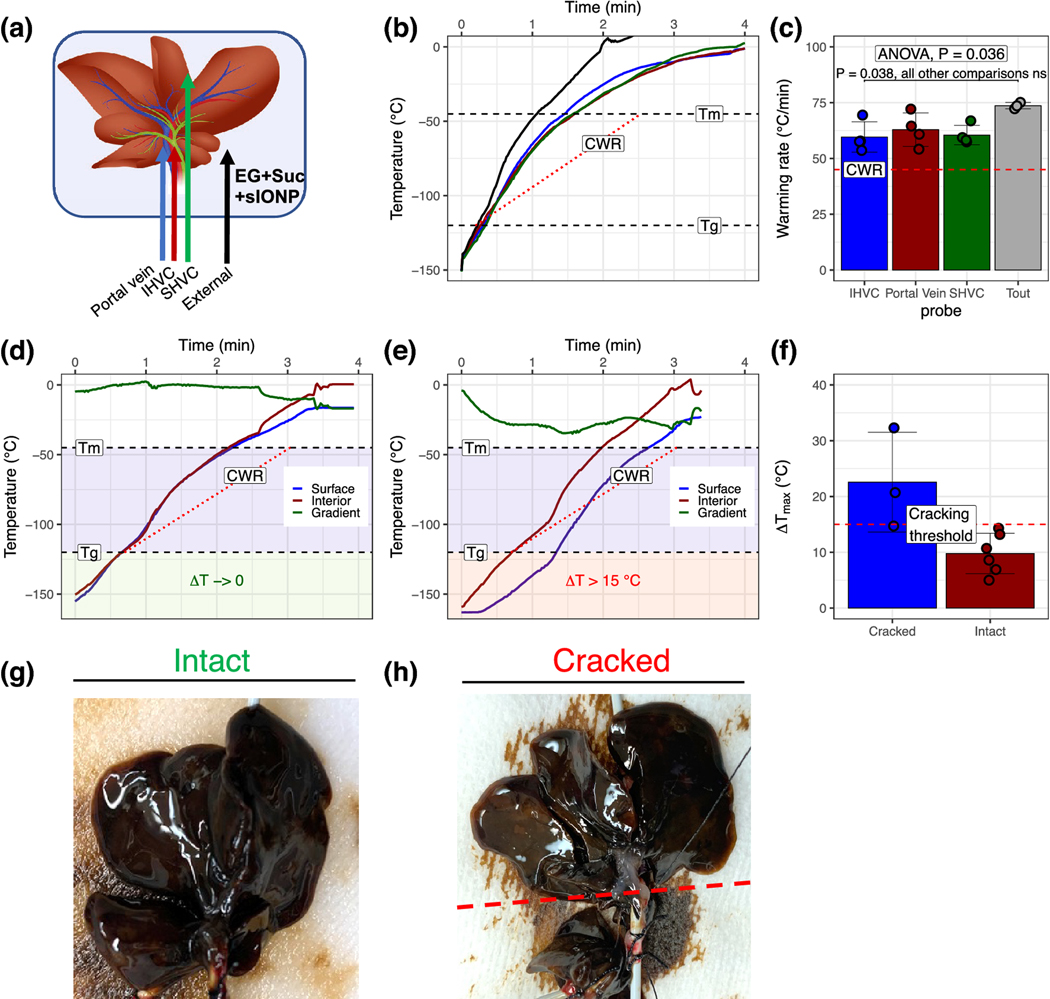
Figure 4. Rewarming of CPA and sIONP-loaded vitrified livers.
(A) Positioning of fluoroptic temperature probes within and around the liver. (B) Temperature vs. time recordings during nanowarming of vitrified rat livers show rewarming at rates exceeding the CWR of CPA (EG+suc) in all liver regions (C). (E) During initial testing, rewarming was initiated from −150 °C at high power (63 kA/m, 185 kHz, right panel). A significant temperature difference (gradient) between the IHVC and the solution around the liver developed rapidly. This difference persisted through the glassy temperature zone (i.e., <Tg, red box), where the system is subject to thermal stress-induced cracking. Under these conditions, visible and audible cracking occurred in the livers (H). (D) When the RF coil energy was initiated at low power between −150 °C and −115 °C (above Tg, green box), temperature differences were much lower and cracking did not occur (G). (F) The measured temperature differences from several experiments were compiled and correlated with the presence or absence of liver cracking. A cutoff of 15 °C was defined as the threshold for cracking. Data are mean ± SD (n = 3–6 per group).

