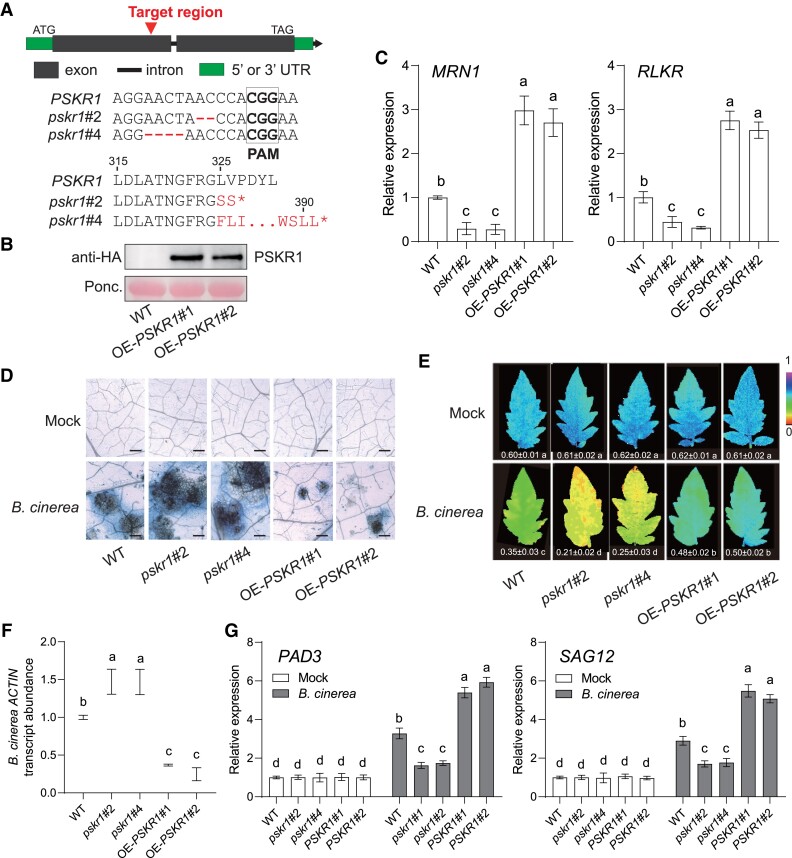
Figure 1.
Role of PSKR1 in defense of tomato plants against B. cinerea. A) Schematic illustration of the sgRNA target site (red arrows) in WT PSKR1 and two alleles (pskr1#2 and pskr1#4) from CRISPR/Cas 9 edited T2 mutant lines. The deleted nucleotide sequences of each line are labeled in red. pskr1#2 and pskr1#4 contained a premature stop codon at 326th and 391th amino acid of the PSKR1 protein, respectively. B) Identification of PSKR1 overexpression lines by immunoblot with an anti-HA antibody. Ponceau S (Ponc.) staining was used as a protein loading control. C) Effects of PSKR1 on the transcript abundance of PSK-responsive genes MRN1 and RLKR. The transcript abundance of each gene in WT plants was defined as 1. D to G) Disease symptoms in PSKR1 mutated and overexpressed lines inoculated with B. cinerea. Five-wk-old tomato plants were sprayed with B. cinerea spore suspension. D) Representative images of trypan blue staining for cell death in indicated tomato leaves at 3 d postinoculation with B. cinerea (dpi). Bar = 250 μm. E) Representative chlorophyll fluorescence imaging of ΦPSII at 3 dpi. The value below each individual image indicates the degree of ΦPSII. F) Relative B. cinerea ACTIN transcript abundance in infected tomato leaves at 1 dpi. The transcript abundance of B. cinerea ACTIN in WT plants was defined as 1. G) Effects of PSKR1 on the gene expression of B. cinerea-induced gene PAD3 and SAG12 in indicated tomato plants at 1 dpi. The transcript abundance of each gene under mock treatment in WT plants was defined as 1. Data are presented in (C, E to G) as the means of three biological replicates (±SD, n = 3), and different letters indicate significant differences (P < 0.05) according to Tukey's test.

