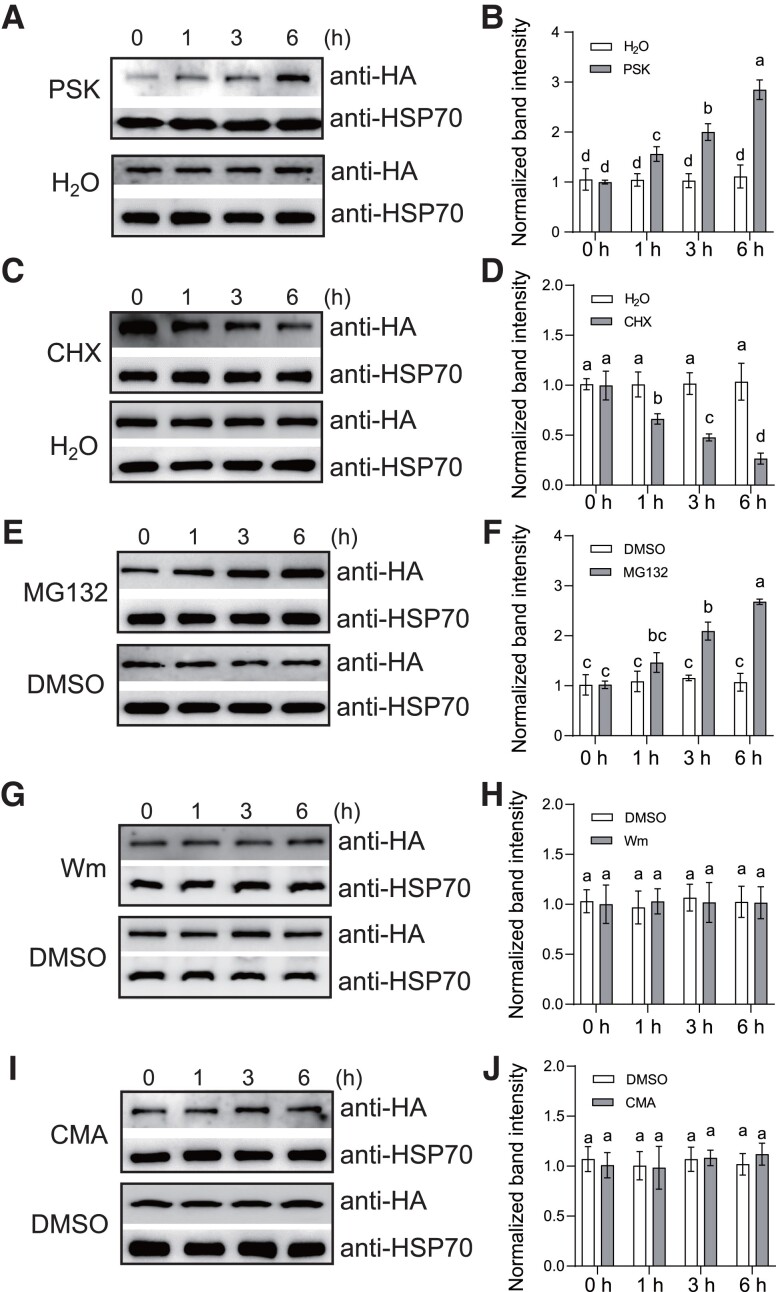
Figure 2.
PSKR1 protein abundance is regulated by the degradation pathway. A) PSK-induced PSKR1 protein abundance. Five-wk-old tomato OE-PSKR1 plants were treated with 1 μM PSK or dH2O for the indicated times. Then the total protein was extracted and subjected to immunoblotting with an anti-HA antibody. Anti-HSP70 was used as a sample loading control. B) Quantification of relative protein intensity in A). The protein abundance of PSKR1 in 0 h of each treatment was defined as 1. C) The protein synthesis inhibitor CHX inhibited PSKR1 protein accumulation. Five-wk-old tomato OE-PSKR1 plants were treated with 200 μM CHX or dH2O for the indicated times. Then the total protein was extracted and subjected to immunoblotting with an anti-HA antibody. Anti-HSP70 was used as a sample loading control. D) Quantification of relative protein intensity in (C). The protein abundance of PSKR1 in 0 h of each treatment was defined as 1. E) The 26S proteasome inhibitor MG132 promoted PSKR1 protein abundance. Five-wk-old tomato OE-PSKR1 plants were treated with 50 μM MG132 or DMSO for the indicated times. Then the total protein was extracted and subjected to immunoblotting with an anti-HA antibody. Anti-HSP70 was used as a sample loading control. F) Quantification of relative protein intensity in (E). The protein abundance of PSKR1 in 0 h of each treatment was defined as 1. G) The vacuolar degradation inhibitor wortmannin (Wm) did not influence PSKR1 protein abundance. Five-wk-old tomato OE-PSKR1 plants were treated with 33 μM Wm or DMSO for the indicated times. Then the total protein was extracted and subjected to immunoblotting with an anti-HA antibody. Anti-HSP70 was used as a sample loading control. H) Quantification of relative protein intensity in (G). The protein abundance of PSKR1 in 0 h of each treatment was defined as 1. I) The vacuolar protease inhibitor CMA did not affect PSKR1 protein abundance. Five-wk-old tomato OE-PSKR1 plants were treated with 0.1 μM CMA or DMSO for the indicated times. Then the total protein was extracted and subjected to immunoblotting with an anti-HA antibody. Anti-HSP70 was used as a sample loading control. J) Quantification of relative protein intensity in (I). The protein abundance of PSKR1 in 0 h of each treatment was defined as 1. Data are presented in (B, D, F, H, J) as the means of three biological replicates (± SD, n = 3), and different letters indicate significant differences (P < 0.05) according to Tukey's test.

