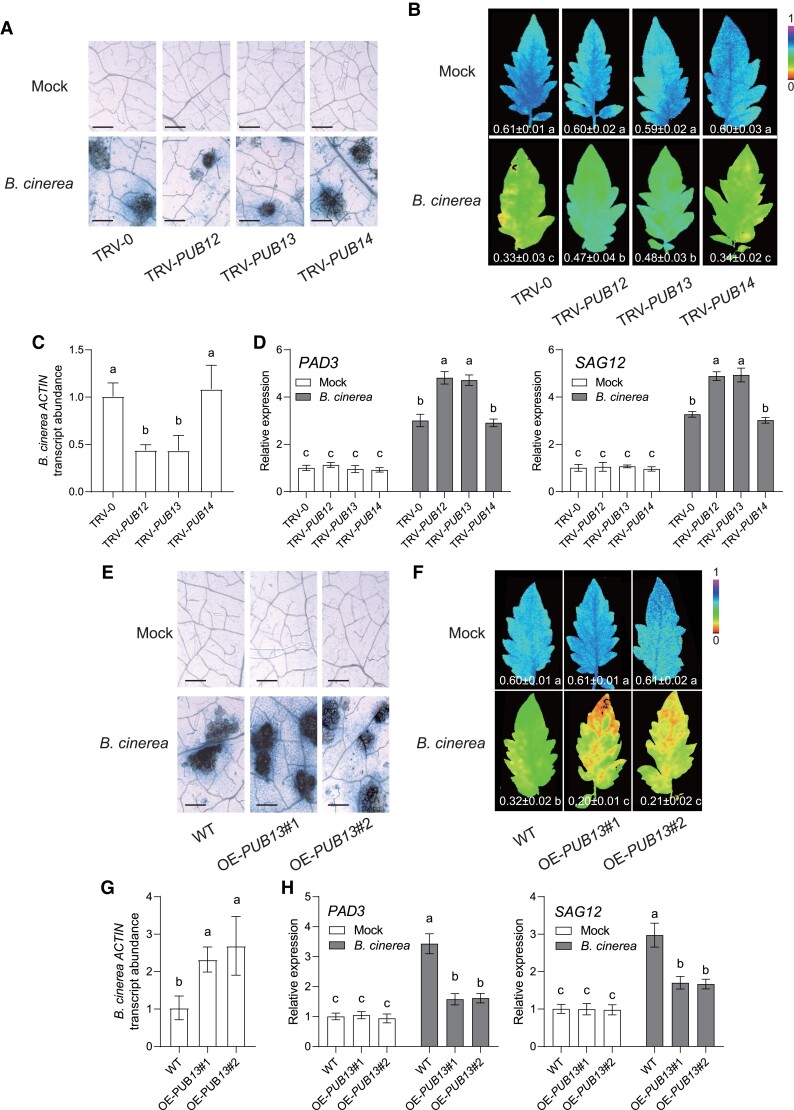
Figure 4.
PUB12 and PUB13 negatively regulated disease resistance against B. cinerea in tomato. A to D) Disease symptoms in tomato PUB-silenced plants inoculated with B. cinerea. A) Representative images of trypan blue staining for cell death in indicated tomato VIGS leaves at 3 d postinoculation with B. cinerea (dpi). Bar = 250 μm. B) Representative chlorophyll fluorescence imaging of ΦPSII at 3 dpi. The value below each individual image indicates the degree of ΦPSII, and the false color code depicted below the image ranges from 0 (black) to 1.0 (purple). C) Relative B. cinerea ACTIN transcript abundance in infected tomato leaves at 1 dpi. The transcript abundance of B. cinerea ACTIN in TRV-0 plants was defined as 1. D) Effects of PUB silencing on the gene expression of B. cinerea-induced genes PAD3 and SAG12 in indicated tomato plants at 1 dpi. The transcript abundance of each gene under mock treatment in TRV-0 plants was defined as 1. E to H) Disease symptoms in tomato OE-PUB13 plants inoculated with B. cinerea. E) Representative images of trypan blue staining for cell death in OE-PUB13 lines and WT plants at 3 dpi. Bar = 250 μm. F) Representative chlorophyll fluorescence imaging of ΦPSII at 3 dpi. The value below each individual image indicates the degree of ΦPSII. G) Relative B. cinerea ACTIN transcript abundance in infected tomato leaves at 1 dpi. The transcript abundance of B. cinerea ACTIN in WT plants was defined as 1. H) Effects of PUB13 overexpression on the gene expression of B. cinerea-induced genes PAD3 and SAG12 in indicated tomato plants at 1 dpi. The transcript abundance of each gene under mock treatment in WT plants was defined as 1. Data are presented in (B to D, F to H) as the means of three biological replicates (±SD, n = 3), and different letters indicate significant differences (P < 0.05) according to Tukey's test.

