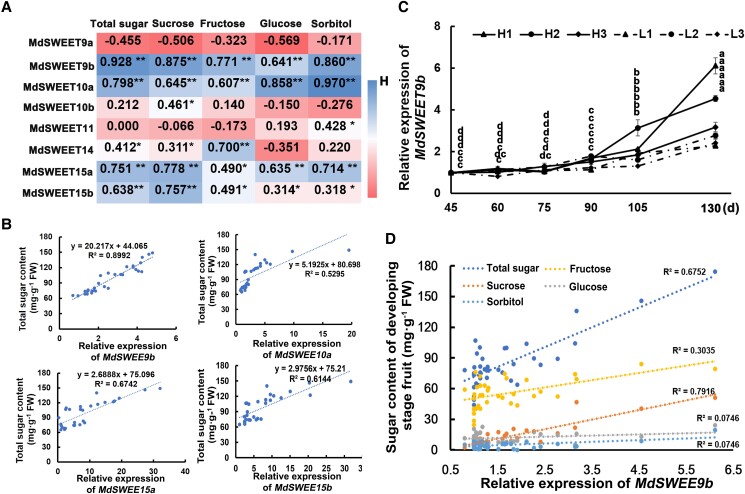
Figure 2.
Analysis of MdSWEET III family expression in different lines and correlation with sugar contents. A) Correlation analysis between MdSWEET III family gene expression level and the content of total sugar and sugar components in different lines. Asterisks indicate statistical significance (**P < 0.01, *P < 0.05, Student's t-test). B) Association analysis of MdSWEET9b/10a/15a/15b expression level and total sugar content in hybrid progenies. C, D) Expression level of MdSWEET9b(C) and its correlation with total sugar and sugar components content (D) in different sugar content lines during development. FW, fresh weight. Analyzed and drawn using Microsoft Excel. The larger the R2, the higher the correlation between the data. Error bars represent the averages of three biological replicates ± SD. Different letters represent differences in the fruit development process. Significance was defined at P < 0.05 (Student's t-test).

