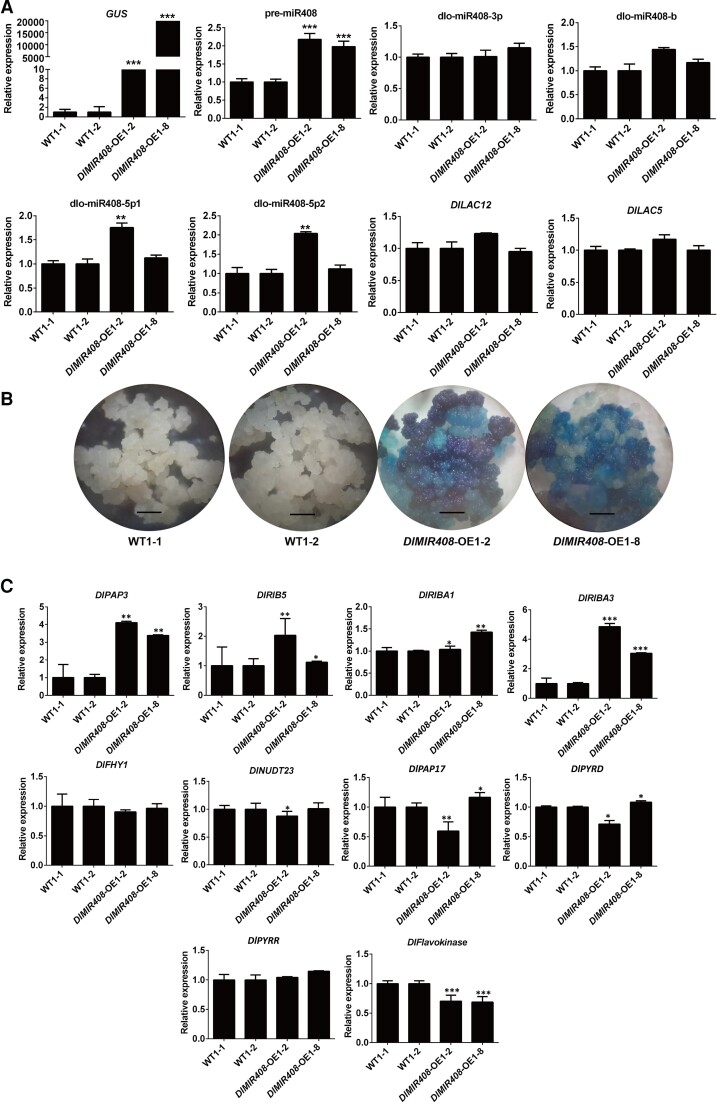
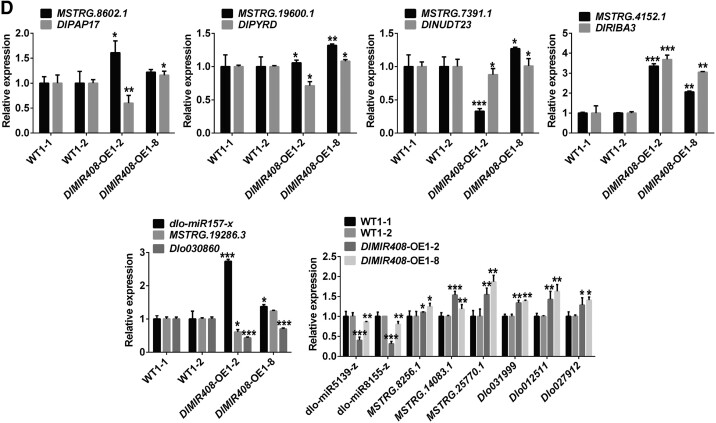
Figure 5.
The transcriptional level validation of dlo-miR408/DlLAC12 and mRNA–miRNA–lncRNA models in DlMIR408-OE stable transgenic cell lines. A) The expression patterns of GUS, pre-miR408, miR408-3p/b/5p1/5p2, and DlLAC12/DlLAC5.B) The GUS histochemical staining of WT (1-1 and 1-2) and DlMIR408-OE (1-2 and 1-8) transgenic cell lines. The scale bar represents 1 mm. C) The expression patterns of riboflavin metabolism-related genes in WT (1-1 and 1-2) and DlMIR408-OE (1-2 and 1-8). D) The expression patterns of the mRNA–miRNA–lncRNA models which participate in riboflavin and phosphate metabolism. Error bars indicate means ± SDs, n = 3 (Duncan’s post hoc test, *P ≤ 0.05, **P ≤ 0.01, ***P ≤ 0.001).


