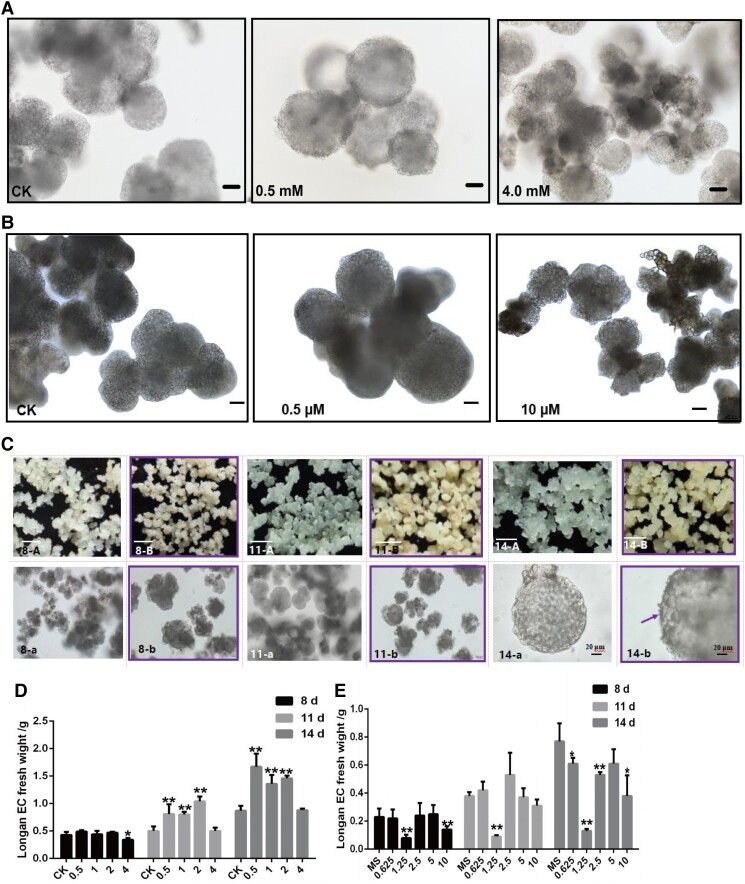
Figure 9.
Cell division and differentiation of longan EC after treating with different concentrations of riboflavin and DPI. A) The cell morphology of longan EC which is treated with CK (0), 0.5, and 4.0 mM riboflavin, culturing at 14 d, respectively, and the scale bars = 100 μm. B) The cell morphology of longan EC treated with CK (0), 0.5, and 10 μM FMN, culturing at 14 d, respectively, the scale bars = 100 μm. C) The morphology of callus and somatic cells which are treated with CK (0 μM) (A, a) and 1.25 μM (B, b) DPI, and culturing at 8 d (8-A, 8-a; 8-B, 8-b), 11 d (11-A, 11-a; 11-B, 11-b), and 14 d (14-A, 14-a; 14-B, 14-b), respectively. In 8-A, 8-B, 11-A, 11-B, 14-A and 14-B, the scale bars = 1 mm. In 8-a, 8-b, 11-a and 11-b, scale bars = 100 μm. In 14-a and 14-b, the scale bars = 20 μm. The purple frame indicates longan EC after 1.25 μM DPI treatment, the purple arrow indicates the surface of the protoderm in GE of longan. D) Longan EC fresh weight with different concentrations of riboflavin treatments, the unit is mM. E) The longan EC fresh weight of different concentrations of DPI treatments, the unit is μM. Error bars indicate means ± SDs, n = 3. Duncan’s post hoc test, *P ≤ 0.05, **P ≤ 0.01, ***P ≤ 0.001.

