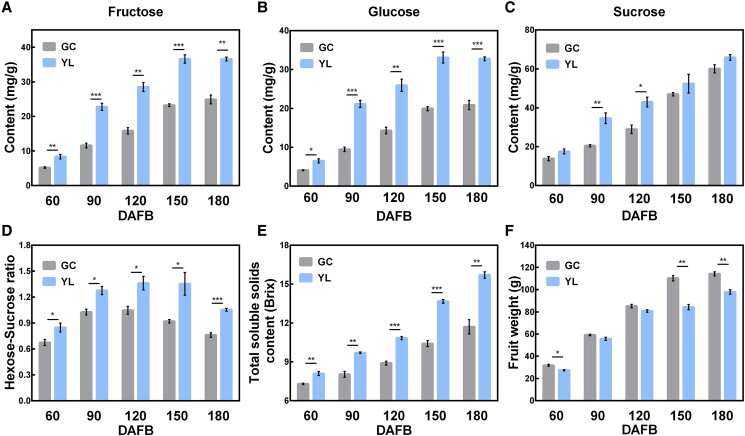
Figure 1.
Sugar profiles in “GC” and “YL” fruits during development. Fructose A), glucose B), and sucrose C) contents of “GC” and “YL” fruits. D) Hexose/sucrose ratio of “GC” and “YL” fruits at different stages of fruit development. Changes in total soluble solids (TSS) E) and fruit fresh weight F). DAFB, days after full bloom. Error bars represent the SE (standard error, n = 3). Asterisks denote significant differences using Student's t-test (*P < 0.05; **P < 0.01; ***P < 0.001).

