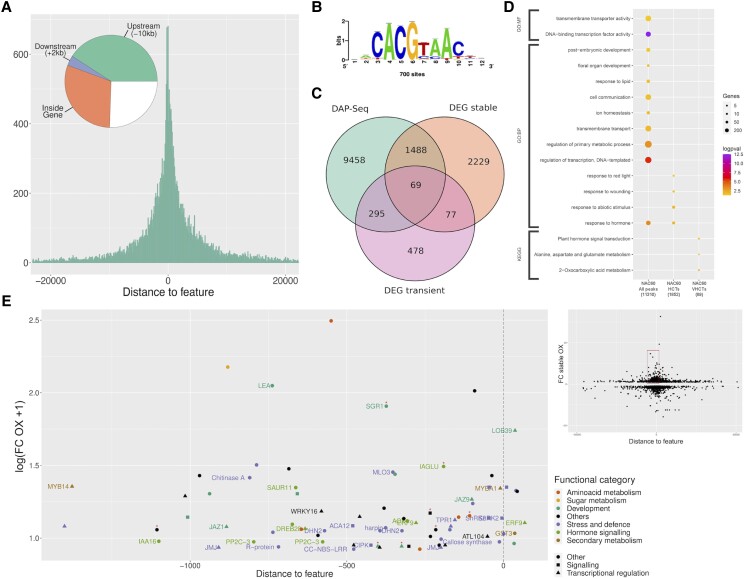
Figure 3.
Identification of VviNAC60 targets by DAP-seq and transcriptomic analysis. A) Distribution of VviNAC60 DNA binding events (27,715 peaks, assigned in at least 1 of the 3 analyses: 500 ng leaf, 1,000 ng leaf, and 500 ng berry) with respect to their position from the transcription start sites (TSS) of their assigned genes (n: 11,310). B) De novo forward binding motif obtained from the inspection of the top 600-scoring peaks of VviNAC60 500 ng leaf library using Regulatory Sequence Analysis Tools (RSAT; k-mer sig = 2.61; e-value = 0.0025; number of peaks with at least one predicted site: 733 = 24.43%). C) Prediction of VviNAC60 targets based on the overlap of DAP-seq assigned genes (sum of the 3 analyses) and DEGs detected in stable and transient VviNAC60-overexpressing plants. D) Functional enrichment analysis of VviNAC60 bound genes (assigned from all peaks) and selected targets (HCTs, high-confidence targets; VHCTs: very high-confidence targets). VHCTs were selected by focusing on peaks in the −1.5 kb and + 100 bp region and on genes with FC ≥ 1.3 in either the stable or transient overexpressing lines. As additional criteria for VHCTs, we only considered peaks present at the same position from the TSS in at least 2 of the 3 analyses. Gene ontology terms and KEGG pathways shown were filtered based on significance (Benjamini–Hochberg adjusted P-value < 0.05) and biological redundancy (complete list of terms can be found in Supplemental Table S4). The size of each dot represents the number of genes in the input query that are annotated to the corresponding term, and the color represents the significance. Total number of genes in each list is shown in parenthesis. GO:BP, Gene Ontology: Biological Process; GO:MF, Gene Ontology: Molecular Function; KEGG, Kyoto Encyclopedia of Genes and Genomes. E, Relationship between peak distances assigned to each gene and differential expression in stable and/or transient VviNAC60 overexpression (OX) lines in selected VHCTs. Fold Change values correspond to the expression in OX lines versus the control lines, with a positive threshold of FC ≥ 1.3. Node color depicts biological processes for each gene, whereas the shape is depicted by its molecular function. Red asterisks depict those genes upregulated in the transient overexpressing lines.

