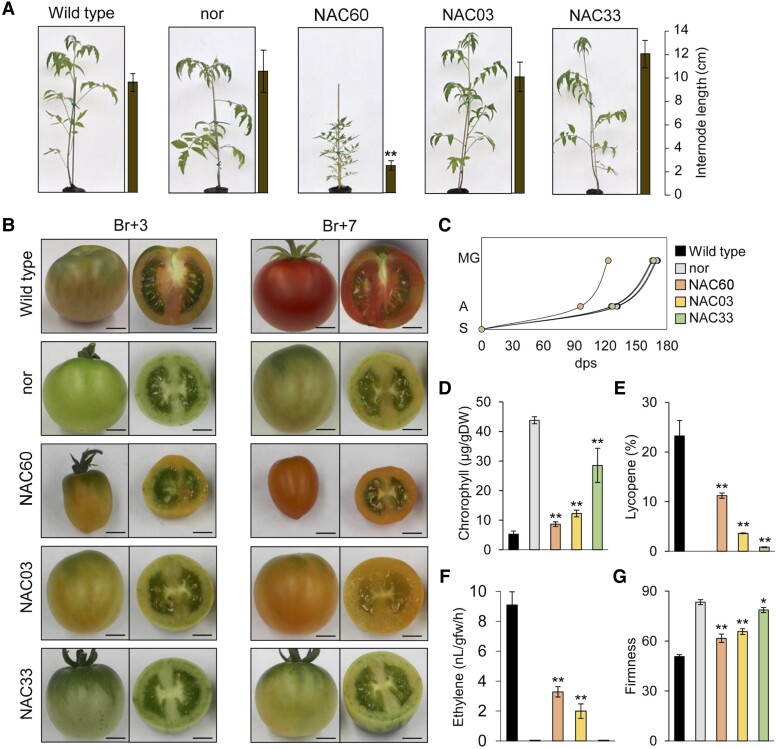
Figure 5.
Phenotypic evaluation of VviNAC60, VviNAC03, and VviNAC33 heterologous expression in nor tomato mutant background. A) Whole tomato plant phenotype corresponding to wild type (Solanum lycopersicum cv. Ailsa Craig), nor and T3 fruit transformed with 35S: VviNAC60, 35S:VviNAC03, and 35S:VviNAC33 in nor tomato mutant background. Internode lengths on plants are indicated by the bars next to each picture. The data are expressed as mean ± SD (n = 4). Asterisks indicate significant differences (**, P < 0.01; t-test) compared to the nor. B) Phenotype of tomato fruits corresponding to wild type, nor and T3 fruit transformed with 35S: VviNAC60, 35S:VviNAC03, and 35S:VviNAC33 in nor tomato mutant background. They were collected at the breaker (Br) + 3 and +7. Bar, 2 cm. C) Growth curve of VviNAC60, VviNAC03, and VviNAC33 transgenic plants in nor background, wild type and nor (n = 9) from seedling to mature green stage. S, seedling; A, anthesis; MG, mature green; dps, day post seedling. D) Chlorophyll content in VviNAC60, VviNAC03, and VviNAC33 transgenic fruits in nor background, wild type and nor at Br + 3. The data are expressed as mean ± SD (n = 4). Asterisks indicate significant differences (**, P < 0.01; t-test) compared to nor. E) Lycopene content in VviNAC60, VviNAC03, and VviNAC33 transgenic fruits in nor background, wild type and nor at Br + 3. The data are expressed as mean ± SD (n = 4). Asterisks indicate significant differences (**, P < 0.01; t-test) compared to the nor. F) Ethylene production in VviNAC60, VviNAC03, and VviNAC33 transgenic fruits in nor background, wild type and nor at Br +5. Each value represents the mean ± standard deviation (SD) of 3 biological replicates. Asterisks indicate significant differences (**, P < 0.01; t-test) compared to nor. G) Fruits firmness of VviNAC60, VviNAC03, and VviNAC33 transgenic fruits in nor background, wild type and nor at Br +3. The data are expressed as mean ± SD (n = 4). Asterisks indicate significant differences (**, P < 0.01; *, P < 0.05; t-test) compared to nor.

