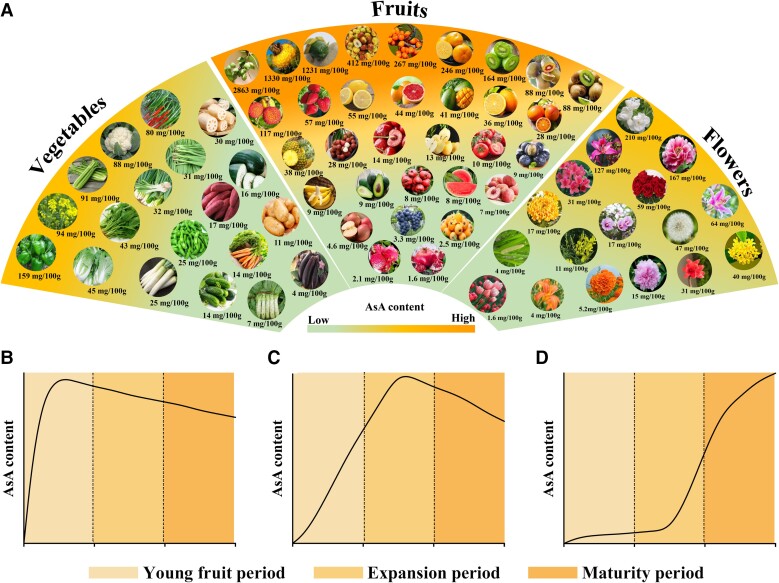
Figure 1.
AsA content in various horticultural crops (A) and accumulation patterns (B–D). All the data and figures were collected from related studies (Ye 2011; Huang 2013) and reports as well as the Web of Science, China National Knowledge Infrastructure, and public websites. Panels B–D represent different AsA accumulation patterns. The data used to draw schematic diagram were obtained from kiwifruit (A. eriantha), Chinese jujube (cv “Mazao”), and chestnut rose (cv “Guinong 5”) (Huang 2013; Lu et al. 2022; Liu et al. 2022b).

