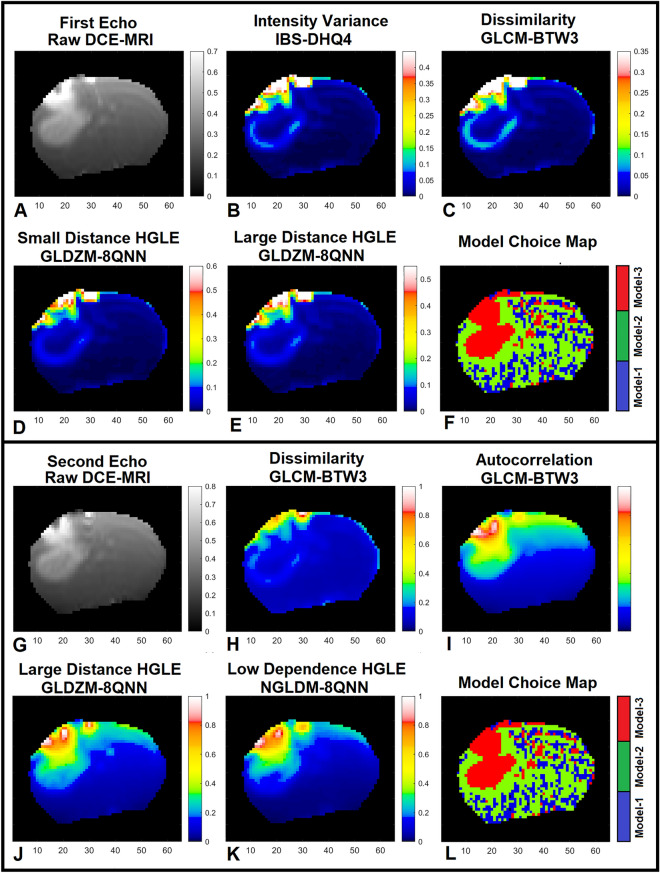
Figure 2.
Subfigures (A–F) demonstrate the 1st echo image of the raw DCE-MRI, its four different significant radiomics maps, and the model choice map estimated by the PK-NMS analysis for a slice of rat brain. Subfigures (G–L) demonstrate the 2nd echo map of raw DCE-MRI, its four different significant radiomics maps, and conventional model choice map (estimated by the PK-NMS) for the same slice of rat brain at timepoint 100 (~ 2 min).

