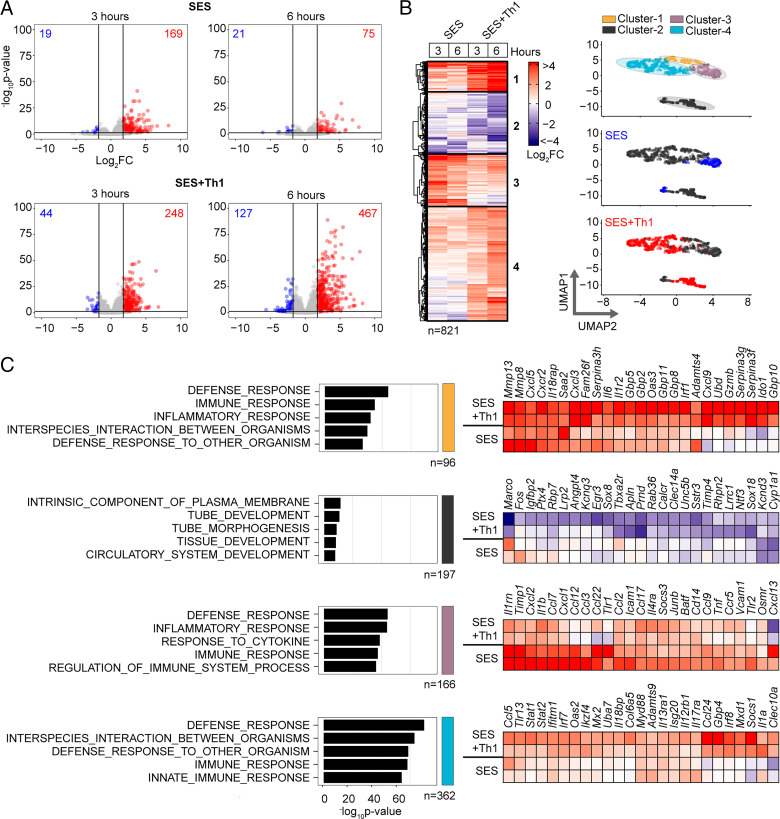
FIGURE 1.
Th1 cells augment the stromal response to acute inflammation. (A) RNA-seq was performed on stromal tissues extracted from SES–challenged mice. Volcano plots show differential expression analysis (limma) and statistical thresholding (padj < 0.05, log2FC > 1.75) of datasets at 3 and 6 h posttreatment. Mice received i.p. SES alone (SES) or SES in combination with Th1 cells (SES+Th1). Each test condition was compared with untreated mice (SES), or mice receiving SES and naive CD4+ T cells. (B) K-means clustering (n = 4) of data shown in (A) (heatmap). Uniform manifold approximation and projection (UMAP) visualizations show the distribution of gene clusters and their link to SES (blue) or SES+Th1 (red) datasets. (C) Gene Ontology (MSigDB) shows the top five biological processes for each cluster (left). Each cluster descriptor is coded to match UMAP clustering colors in (B). Representative examples of genes in each cluster are presented as heatmaps (right).

