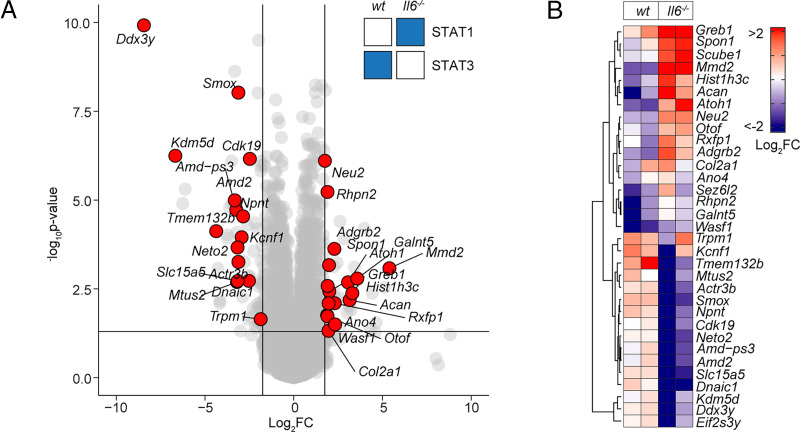
FIGURE 5.
STAT1 and STAT3 interplay shapes gene regulation. (A) Volcano plot of RNA-seq data showing differentially regulated gene expression (Il6−/− versus wt; padj < 0.05, log2FC > 1.75) in SES+Th1–treated Il6−/− mice (3 h postadministration). Differential gene regulation is shown for representative genes displaying reciprocal STAT1 and STAT3 binding in ChIP-seq datasets from wt and Il6−/− mice (summarized in inset). (B) Euclidean clustering of the 33 genes depicted in (A).

