FIGURE 6.
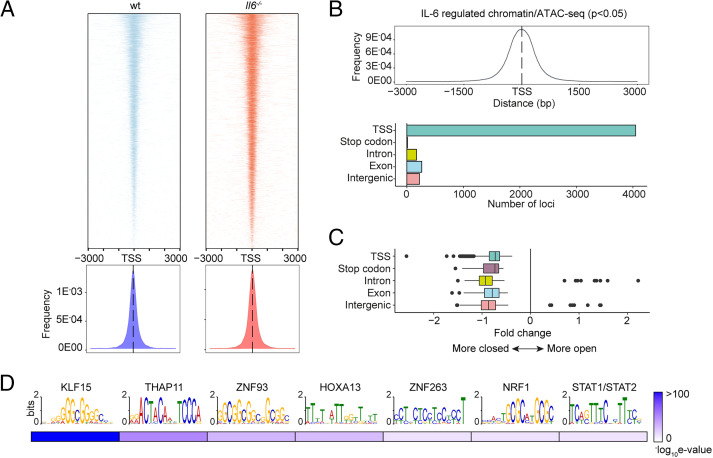
Mapping of chromatin accessibility by ATAC-seq. (A) Heatmap visualization of ATAC-seq profiling of peritoneal extracts from mice treated with SES and Th1 cells (top). The peak count frequency of sequence reads associated with transcription start sites (TSS) is shown for wt and Il6−/− mice (bottom). (B) Histogram shows chromatin accessibility at TSS linked with IL-6–regulated genes (top). Graph shows the genomic distribution of IL-6–regulated loci (bottom). (C) Fold change (Il6−/− versus wt) in ATAC-seq reads at indicated genomic features. (D) Motif enrichment analysis (MEME-ChIP) of genomic regions identified in differential binding analysis of ATAC-seq datasets. Annotations identify putative transcription factor motifs associated with sequencing peaks.

