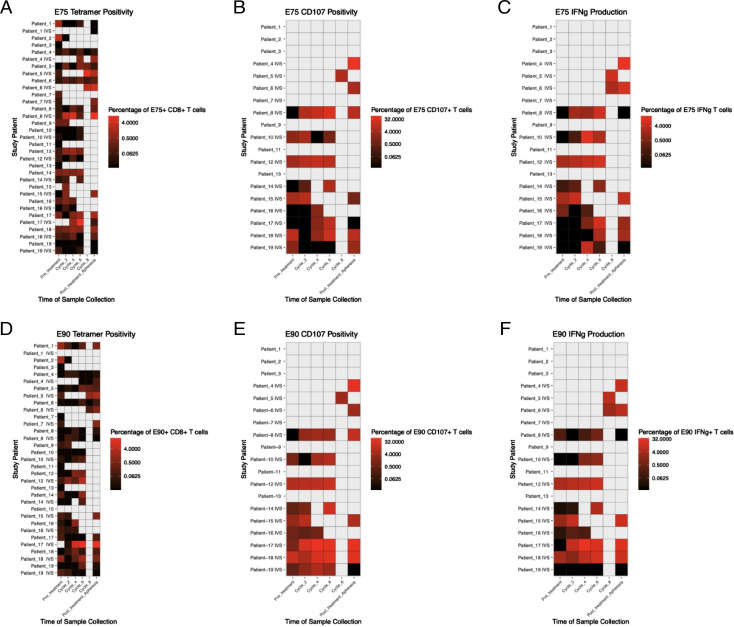
FIGURE 3.
Immune monitoring results in the LCCC 0418 study cohort. Leukapheresis samples were analyzed before first vaccination and at the end of the study. Peripheral blood samples were analyzed on the days of cycles 2, 4, 6, and 8 in vaccinated patients. Heatmaps show (A) frequency of E75-specific CD8+ T cells, (B) frequency of CD8+ T cells positive for CD107 surface staining after stimulation with E75 peptide, (C) frequency of CD8+ T cells expressing IFN-γ after stimulation with E75 peptide, (D) frequency of E90-specific CD8+ T cells, (E) frequency of CD8+ T cells positive for CD107a surface staining after stimulation with E90 peptide, and (F) frequency of CD8+ T cells expressing IFN-γ after stimulation with E90 peptide. Gray boxes represent time points when samples were not collected.

