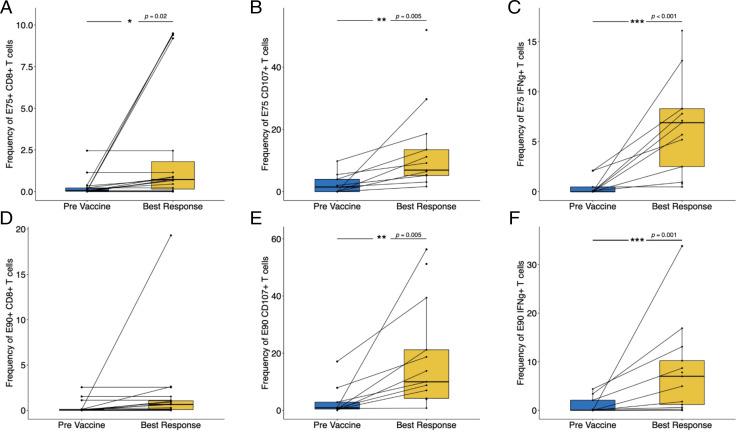
FIGURE 4.
Increase of E75- and E90-specific T cell responses in treated patients. Pretreatment immune monitoring measurements were compared with the time point of best response on treatment: (A) frequency of E75-specific CD8+ T cells, (B) frequency of CD8+ T cells positive for CD107 surface staining after stimulation with E75 peptide, (C) frequency of CD8+ T cells expressing IFN-γ after stimulation with E75 peptide, (D) frequency of E90-specific CD8+ T cells, (E) frequency of CD8+ T cells positive for CD107 surface staining after stimulation with E90 peptide, and (F) frequency of CD8+ T cells expressing IFN-γ after stimulation with E90 peptide.

