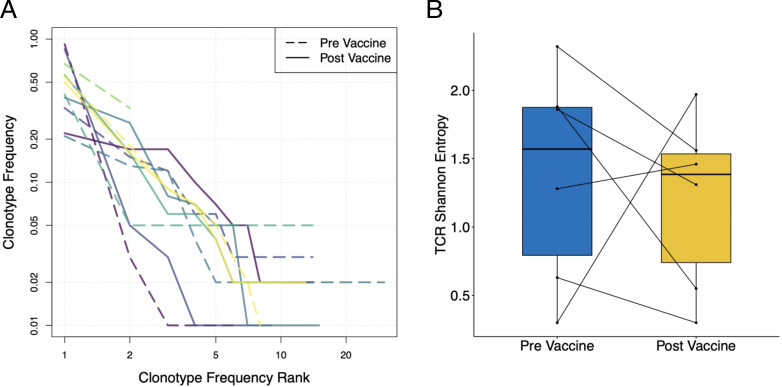
FIGURE 5.
TCRβ repertoire profiling in treated patients. (A) Rank-frequency plot showing frequency distributions of prevaccine (dashed lines) and postvaccine (solid lines) E75-specific CD8+ T cell populations. Distinct colors represent individual patients. (B) TCR repertoire diversity measurements of E75-specific CD8+ T cell populations before and after vaccine therapy.

