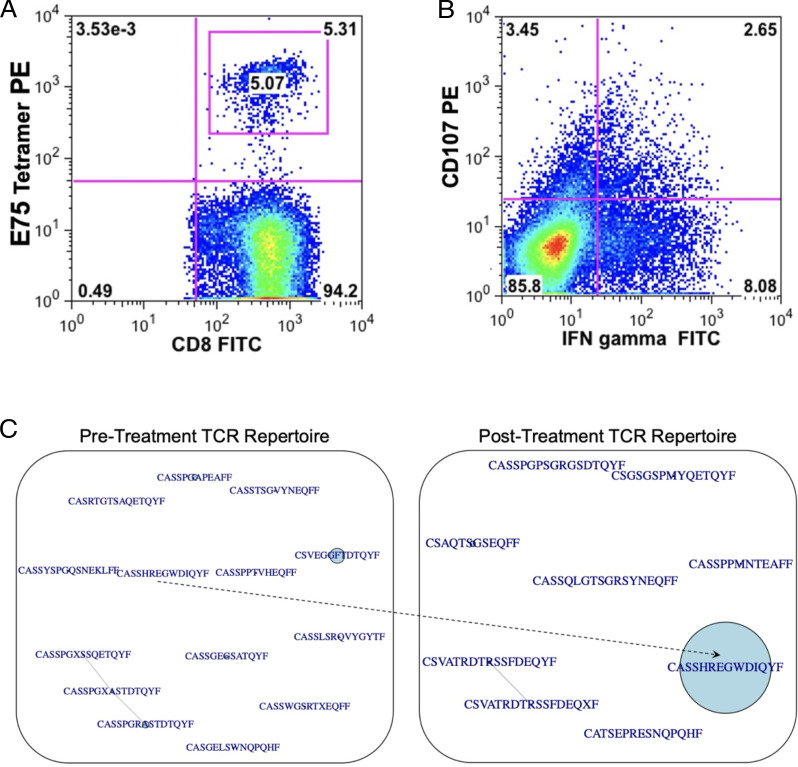
FIGURE 6.
Robust E75-specific CD8+ T cell responses in an exceptional responder. (A) Frequency of E75-specific CD8+ T cells. (B) Frequency of CD8+ T cells positive for CD107 surface staining after stimulation with E75 peptide (y-axis) and frequency of CD8+ T cells expressing IFN-γ after stimulation with E75 peptide (x-axis). (C) Sequence similarity networks showing TCR repertoires of the sorted E75-specific CD8+ T cells. TCR clonotypes were considered identical if they expressed the same V gene, J gene, and CDR3 gene segment. CDR3 amino acid sequences are shown, with central circles corresponding to relative abundance in the TCR repertoire. The sequence CASSHREGWDIQYF was present in a low frequency in the pretreatment repertoire and expanded to become a dominant clonotype in the posttreatment TCR repertoire.

