
FIGURE 10.
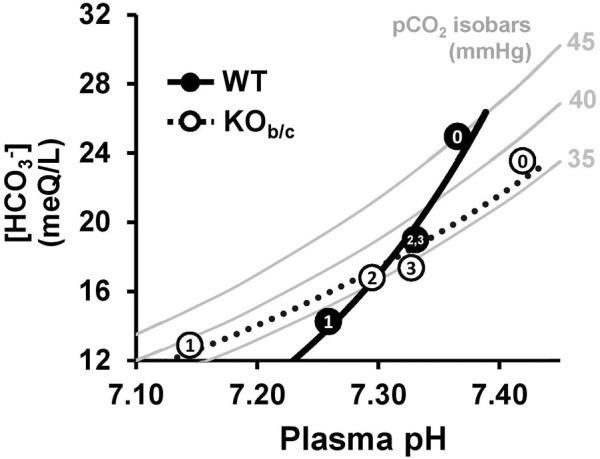
Davenport diagram illustrating acid-base status of WT and KOb/c mice during 3-day MAc-challenge. Grey bars represent pCO2 isobars for pCO2 levels of 35, 40, and 45 mmHg, which represent all the possible combinations of plasma pH and [HCO3 −] for the given pCO2 level according to the Henderson-Hasselbalch relationship. The average of each acid-base parameter at baseline and during each day of the 3-day MAc-challenge are represented as filled circles for WT mice and open circles for KOb/c mice, with the numbers (0–3) representing each day of the experiment (data taken from Figure 6). Both data sets were fitted with an exponential trend line. Note the crossing of all 3 isobars by the WT trend line whereas the KOb/c trend line closely follows the 35 mmHg isobar. This reflects the intact ability of WT mice to adjust respiration given the severity of acidosis whereas in KOb/c mice this respiratory response is impaired.