FIGURE 3.
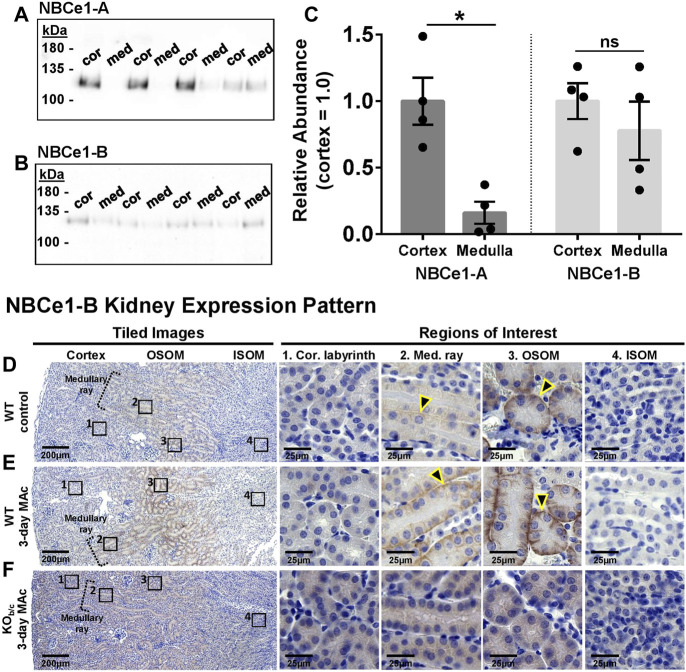
NBCe1-A and NBCe1-B kidney expression. (A,B) Immunoblot analysis of protein preparations from micro-dissected cortex (cor) and medulla (med) from WT mice. Two gels were identically loaded (2 µg/lane) and probed with the anti-NBCe1-A (A) or anti-NBCe1-B/C (B) antibody. (C) Quantification of Western blot results, with medullary abundance normalized to average cortical abundance. There was significantly more NBCe1-A abundance in the cortex than medulla, whereas there was no difference in NBCe1-B abundance between the cortex and medulla (n = 4). (D–F) Immunohistochemistry examining NBCe1-B immunolabeling in the cortical labyrinth, cortical medullary ray, outer stripe of outer medulla (OSOM), and inner stripe of outer medulla (ISOM). Left-hand images are tiled images, and right-hand images are higher magnified regions of interest. (D) Under control conditions, NBCe1-B was detectable in the basolateral membrane of PTs located in the cortical medullary ray and OSOM (arrowheads), but was not detectable in PTs of the cortical labyrinth or in the ISOM. (E) After 3 days of MAc, NBCe1-B immunolabel intensity qualitatively increased in PTs located in the cortical medullary ray and OSOM (arrowheads). (F) No basolateral NBCe1-B immunoreactivity was observed in KOb/c mice after 3 days of MAc. Images are representative of 3 replicate experiments each. *p < 0.05 by Student’s 2-tailed unpaired t-test; ns, non-significant.

