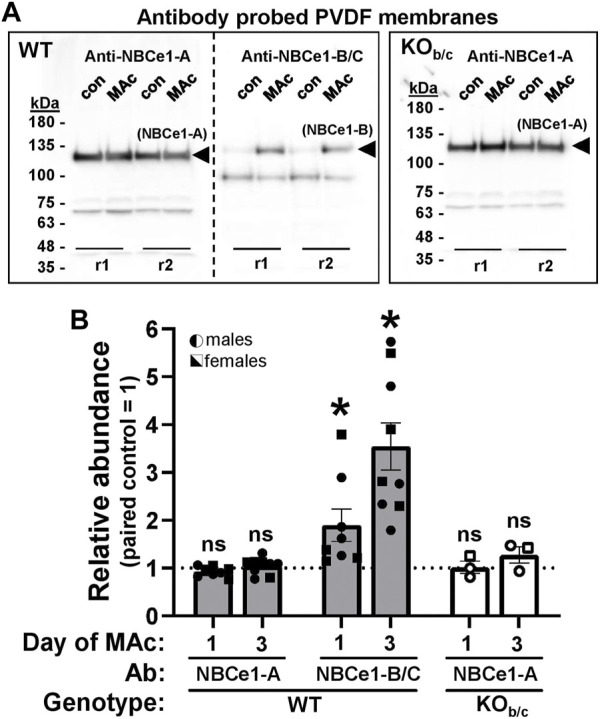
FIGURE 4.

Abundance response of renal NBCe1-A and NBCe1-B during MAc. (A) Chemiluminescent images of western blots, loaded with 10 µg/lane of protein prepared from paired, sex-matched, littermates kept under control (con) or 3-days of metabolic acidosis (MAc) conditions. Two intra-assay replicates for each mouse pair (r1 and r2) were included in each experiment. For WT, each set of replicates was loaded twice for probing with either an NBCe1-A or NBCe1-B specific antibody (left and right sides of blot). For KOb/c, replicates were only loaded once for probing with the NBCe1-A specific antibody. Bands representing NBCe1-A and NBCe1-B abundance are observed at ∼125 kDa. The lower molecular weight (∼100 kDa) bands in the anti-NBCe1-B/C treated blot are endogenous mouse immunoglobulin subunits resulting from DTT reduction of intact immunoglobulin (Ahmad-Zadeh et al., 1971), which would otherwise interfere with measurement of NBCe1-B abundance. We are unsure of the identity of the ∼70 kDa band in the anti-NBCe1-A treated blots. (B) Quantification of NBCe1-A and NBCe1-B abundance in WT mice, and NBCe1-A abundance in KOb/c mice, after 1- or 3-days of MAc. ‘Relative Abundance’ during MAc is relative to that of a paired, sex-matched, littermate subjected to control conditions, such that each point in Figure 4B represents a single MAc/control pair (i.e., control = 1, represented by the dotted line). *p < 0.05 by Student’s 2-tailed unpaired t-test; ns, non-significant; WT 1-day: n = 4M/4F, 3-day: n = 5M/4F; KOb/c: n = 2M/1F for both 1- and 3-day.
