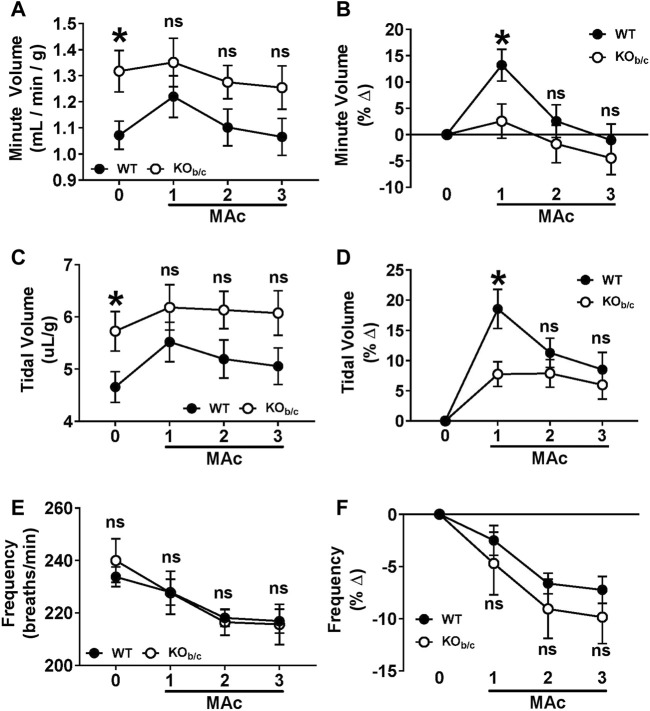
FIGURE 5.
Ventilation response of KOb/c mice during 3-day MAc-challenge. Minute volume (A,B), tidal volume (C,D), and frequency (E,F) were measured for 2-days under non-challenged conditions and averaged for use as baseline data (timepoint “0”), followed by 3-days of MAc-challenged conditions (timepoints “1–3”). Panels A, C, and E show the averaged parameter values, and panels B, D, and F show the average % change from baseline, for each genotype after each day of the 3-day MAc-challenge. (A) Minute volume. At baseline, KOb/c minute volume was significantly higher than WT (timepoint 0), but there were no significant differences during MAc (timepoints 1–3). (B) When normalized to baseline, WT mice exhibited a significant % change in minute volume in response to MAc (p < 0.001, RM-ANOVA) that was not observed in KOb/c mice (p = 0.227, RM-ANOVA). Furthermore, the % change in minute volume after 1 day of Mac was significantly greater in WT mice than KOb/c mice (timepoint 1). (C) Tidal Volume. At baseline, KOb/c tidal volume was significantly higher than WT (timepoint 0), but there were no differences during MAc (timepoints 1–3). (D) When normalized to baseline, both WT and KOb/c mice exhibited a significant % change in tidal volume in response to MAc (WT: p < 0.001, KOb/c: p = 0.007; RM-ANOVA), but the % change in tidal volume after 1 day of MAc was significantly greater in WT mice than KOb/c mice (timepoint 1). (E) Frequency. There were no significant differences between WT and KOb/c frequencies at baseline or during the MAc-challenge. (F) When normalized to baseline, both WT and KOb/c mice exhibited a significant % change in frequency in response to MAc (WT: p < 0.001, KOb/c: p = 0.007; RM-ANOVA). There were no significant differences in % change in frequency between WT and KOb/c mice on any day of the MAc-challenge. *p < 0.05 between WT and KOb/c mice at each day noted, assessed by Student’s 2-tailed unpaired t-test; ns, non-significant; WT: n = 5M/6F; KOb/c: n = 7M/4F.

