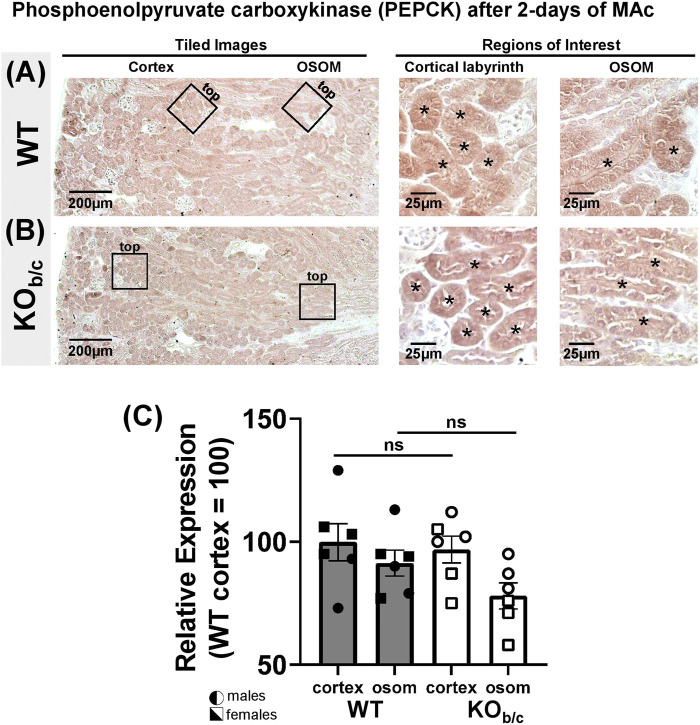
FIGURE 8.
Phosphoenolpyruvate carboxykinase (PEPCK) kidney expression in WT and KOb/c mice after 2-day MAc-challenge. (A,B) Representative low and high magnification light-microscopy images of PEPCK immunostaining in WT (A) and KOb/c (B) mice exposed to 2-days of MAc-challenged conditions. High magnification images of cortex and OSOM regions of interest were used for quantification of PEPCK expression in each region. Asterisks signify tubule lumens. (C) Quantification of PEPCK expression in the cortex and OSOM of WT and KOb/c mice normalized such that the average in WT cortex is 100%. Comparisons between WT and KOb/c groups assessed by Students 2-tailed unpaired t-test; ns, non-significant. N = 3M/3F per group.

