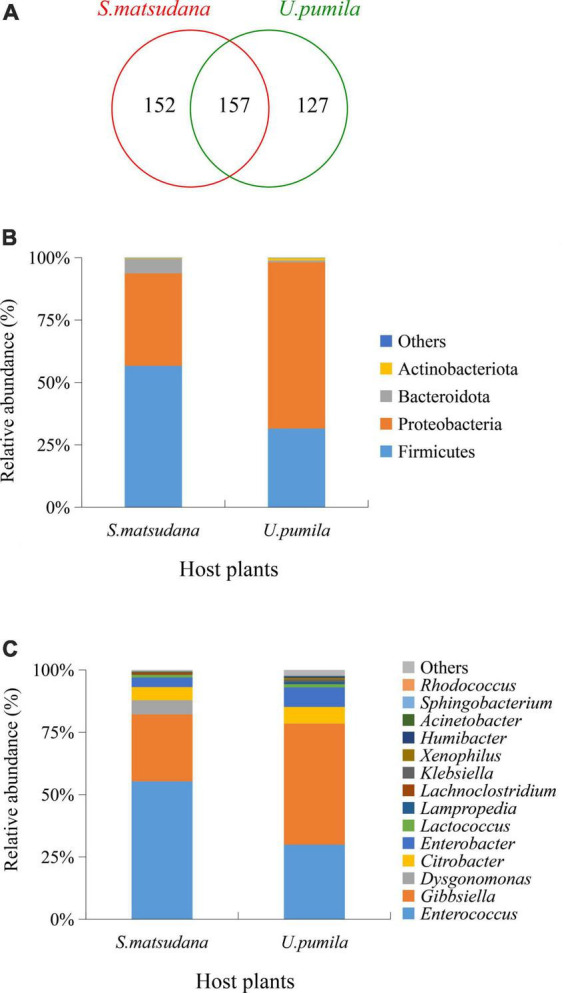
FIGURE 2.

Gut bacteria composition identified in A. glabripennis larvae reared on S. matsudana and U. pumila. Venn diagram represents the number of shared and specific OTUs (A). Relative abundances of bacterial communities at phylum (B) and genus (C) levels for A. glabripennis are illustrated. Columns represent different samples, different colors represent different annotated information, and “others” represents all species except those annotated above.
