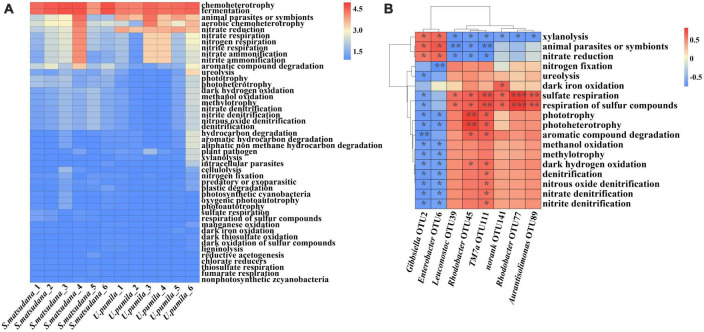
FIGURE 5.
Functional predictions (A) and the relationship between OTUs and functional abundance (B) of the gut bacteria communities of A. glabripennis larvae reared on S. matsudana and U. pumila. The color scale represents the normalized values of relative abundances by log10 (A), blue indicates negative correlation, red indicates positive correlation, and a darker color indicates a stronger correlation (*p < 0.05, **p < 0.01, ***p < 0.001) (B).

