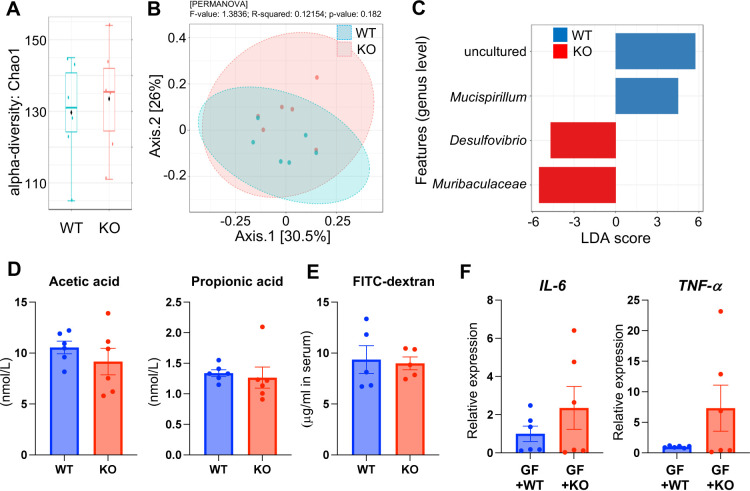
Fig. 3.
Gut microbiota composition in wild-type (WT) and L-amino acid oxidase-1 knock-out (LAO1 KO) mice. Alpha-diversity Chao1 richness box plot (A). Principal component analysis (PCoA) plots based on unweighted UniFrac distance matrices of microbial communities in WT and LAO1 KO mice (B). Specific genera identified by linear discriminant analysis (LDA) effect size (LEfSe) in the feces of WT and LAO1 KO mice (C). The concentration of acetic acid and propionic acid in the feces of WT and LAO1 KO mice (D). The concentration of fluorescein isothiocyanate-conjugated dextran (FITC) (µg/mL) after four-hour administration of FITC-dextran in serum of wild-type (WT) and LAO1 KO mice (E). Comparison of interleukin-6 (left), and tumor necrosis factor-α (right) mRNA expression in the liver from germ-free (GF) mice transplanted with WT (GF+WT) and LAO1 KO (GF+KO) mice feces (F).

